Warming stripes

LonglistClimate change is a complex global issue, requiring simple communication about its effects at the local scale. This set of visualisations highlight how we have witnessed temperatures change across the globe over the past century or more. The colour of each stripe represents the temperature of a single year, ordered from the earliest available data at each location to now. All other superfluous information is removed so that the changes in temperature are seen simply and undeniably.

Annual global temperatures from 1850-2017
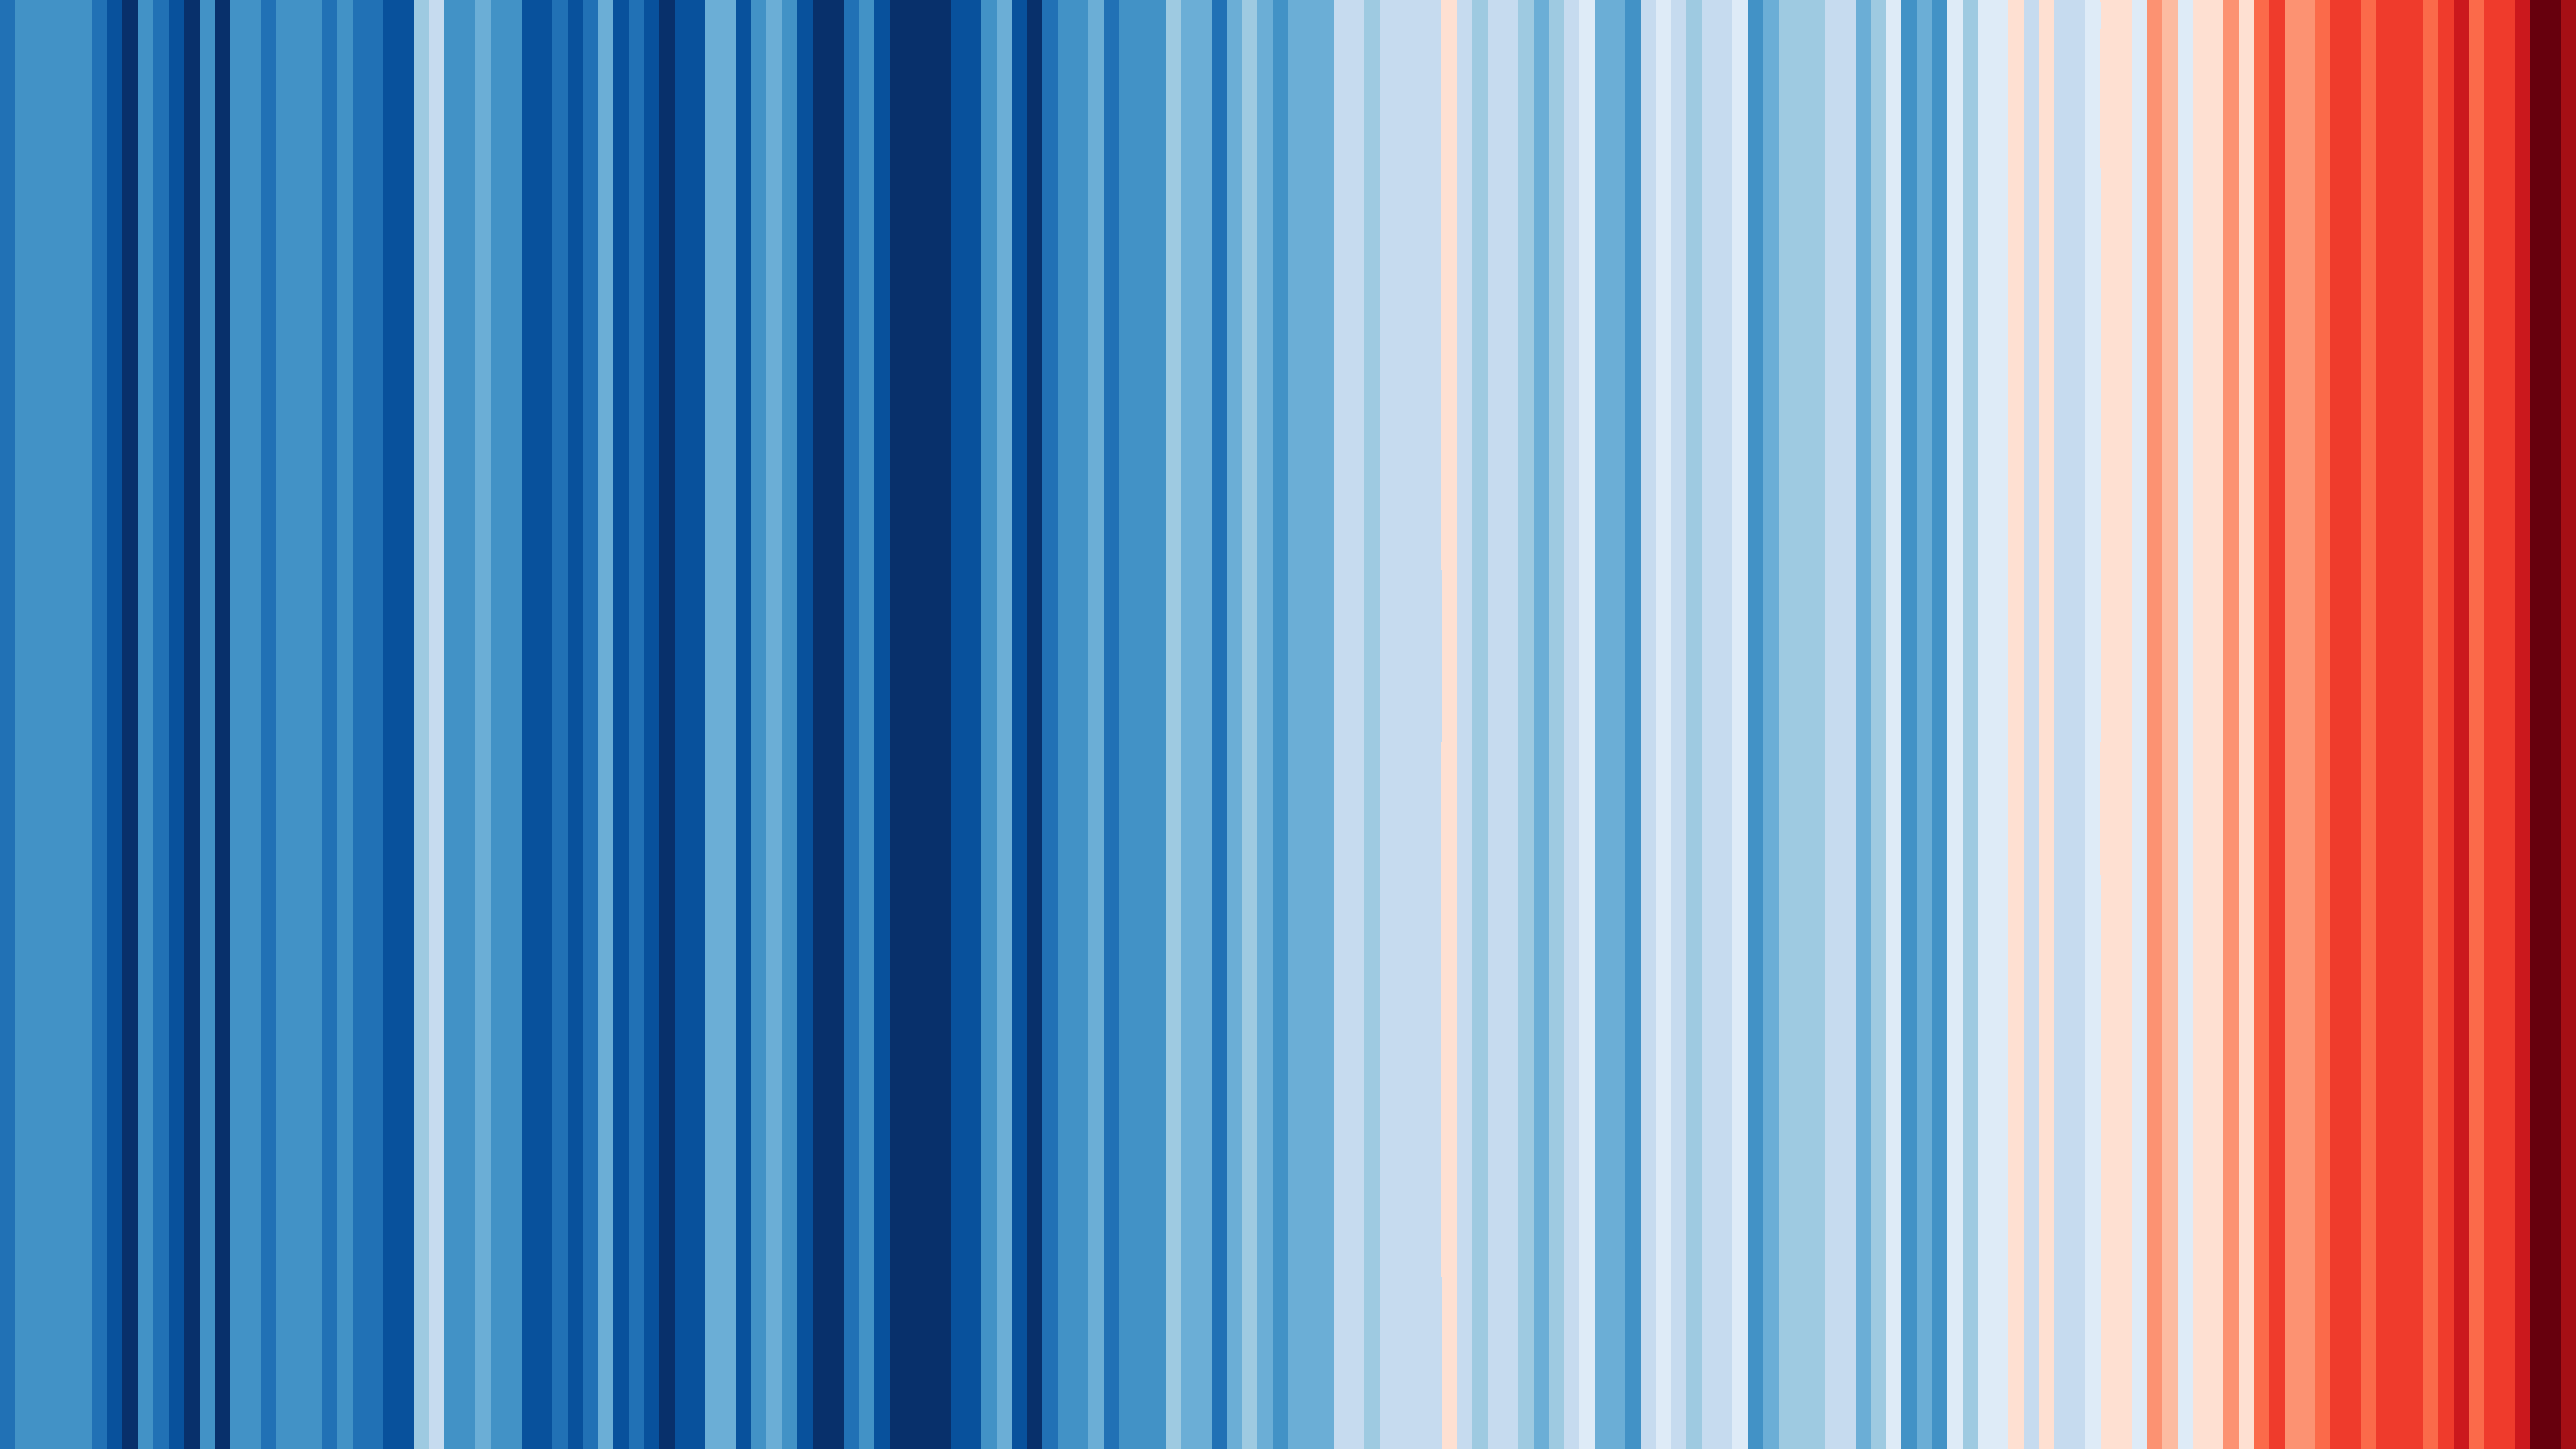
The colour scale represents the change in global temperatures covering 1.35°C [data]
Continue reading Warming stripes

John Tyndall: founder of climate science?

John Tyndall (c.1822–1893), Irish physicist, mountaineer, and public intellectual, is best known for his work on the absorption of heat by gases such as water vapour and carbon dioxide in the atmosphere (and for explaining why the sky is blue). Seen in retrospect, he is a critical figure in the history of climate science. Yet this retrospective view hides a complex, and in many ways more interesting story.

In The Ascent of John Tyndall, the first major biography of Tyndall for more than 70 years, I unpick the motivations behind Tyndall’s work on the absorption of heat by gases, which started in 1859, and the manner in which he interpreted them.

Guest post by Roland Jackson Continue reading John Tyndall: founder of climate science?

Trends in extremes

Twenty years ago, the trend in annual mean global mean temperature became detectable. Ten years ago, regional seasonal mean temperature trends were becoming clear. Nowadays, we can see trends even in weather extremes. In this post I show trends in long-term meteorological station data for hot, cold and wet extremes, and share some thoughts on tropical cyclones and droughts. It is underpinned by a decade of studying these around the globe, often in collaboration with the WWA team. I make no claims for completeness: the world is large and complicated, and I simply do not know all the literature.

Guest post by Geert Jan van Oldenborgh
Continue reading Trends in extremes

Uncertainty in warming since pre-industrial times

The consequences of the Paris Agreement’s choice of the pre-industrial as its baseline have been discussed previously on this blog. This choice makes sense from a climate forcing perspective (as radiative forcings are measured with respect to a quasi-equilibrated state, and the well-observed recent past is not close to have finished responding to anthropogenic drivers). Looking back into the pre-industrial period, there are fewer instrumental observations of the temperature across the globe. So naturally our knowledge of the pre-industrial baseline temperature is uncertain.

Recent work, such as Hawkins et al. (2017) and Schurer et al. (2017), have looked to assess and quantify this uncertainty in light of future targets. The magnitude of this uncertainty, although small, becomes important when you consider the amount of warming left between today and the 1.5°C target. Continue reading Uncertainty in warming since pre-industrial times

Is the 1.5°C target still reachable?

In the Paris climate agreement it was agreed to limit global warming to well below 2 degrees Celsius and to drive efforts to limit the temperature increase even further to 1.5 degrees Celsius above pre-industrial levels. There has been a debate whether the ambitious climate change mitigation goal of 1.5 °C is still within reach. This was fueled by a paper by Millar et al (NGS, 2017), which claimed there was still a reasonable carbon budget left to reach this very ambitious goal. Others claim this is already physically impossible. We try to find out why they reach different conclusions. Two factors are important: definitions and cancellations of temperature trends after fossil CO2 emissions would cease. A similar discussion with other emphasis has been written by the authors of Millar et al. It is all about tenths of degrees. Continue reading Is the 1.5°C target still reachable?

What do future eruptions mean for climate projections?

The world has not seen a major volcanic event for at least 25 years, but the tropical volcano Mt Agung on Bali is now threatening to erupt. Mt Agung’s last eruption in 1963 was one of the largest during the 20th century and had widespread climatic effects. Going further back in time, ice core-based volcanic reconstructions reveal events – such as the Samalas eruption in 1257 in Indonesia – that were an order of magnitude larger than the 1963 eruption of Mt Agung.

Because the timing and intensity of eruptions cannot be predicted in advance, they are commonly excluded from projections of future climate. The imminent eruption of Mt Agung raises important questions: How feasible and important is the inclusion of potential volcanism in future climate projections? Will eruptions help mitigating long-term anthropogenic global warming? What is their effect on climate projection uncertainty? How do eruptions affect future climate variability and the likelihood of climate extremes? Continue reading What do future eruptions mean for climate projections?

Are the models “running too hot”?

Recent media headlines have again discussed the issue of whether climate models are overly sensitive to greenhouse gases. These headlines have misinterpreted a study by Millar et al. which was discussing carbon budgets to limit global temperature rise to 1.5°C above pre-industrial levels.

A recent study by Medhaug et al. analysed the issue of how the models have performed against recent observations at length and largely reconciled the issue. An overly simplistic comparison of simulated global temperatures and observations might suggest that the models were warming too much, but this would be wrong for a number of reasons. Continue reading Are the models “running too hot”?