Twenty years ago, the trend in annual mean global mean temperature became detectable. Ten years ago, regional seasonal mean temperature trends were becoming clear. Nowadays, we can see trends even in weather extremes. In this post I show trends in long-term meteorological station data for hot, cold and wet extremes, and share some thoughts on tropical cyclones and droughts. It is underpinned by a decade of studying these around the globe, often in collaboration with the WWA team. I make no claims for completeness: the world is large and complicated, and I simply do not know all the literature.
Guest post by Geert Jan van Oldenborgh
The obvious first-order hypothesis is that warm extremes are getting warmer and cold extremes less cold. Severe precipitation tends to increase due to the higher moisture content of warmer air. Sea level rise simply heightens storm surges. Other extremes do not have as obvious first-order trends.
The figures are based on GHCN-D station data from NOAA/NCEI and can easily be reproduced on the KNMI Climate Explorer. I demanded at least 50 years of data and a minimum distance between station of 0.5º. I used the daily average temperature, defined as the average of maximum and minimum temperatures. This quantity is less sensitive to changes in observing practices and surroundings than either minimum or maximum temperatures alone, e.g., decreased ventilation due to trees growing affects minimum and maximum temperatures with opposite signs. There are no obvious urban/rural contrasts in the maps, so they mainly reflect large-scale trends.
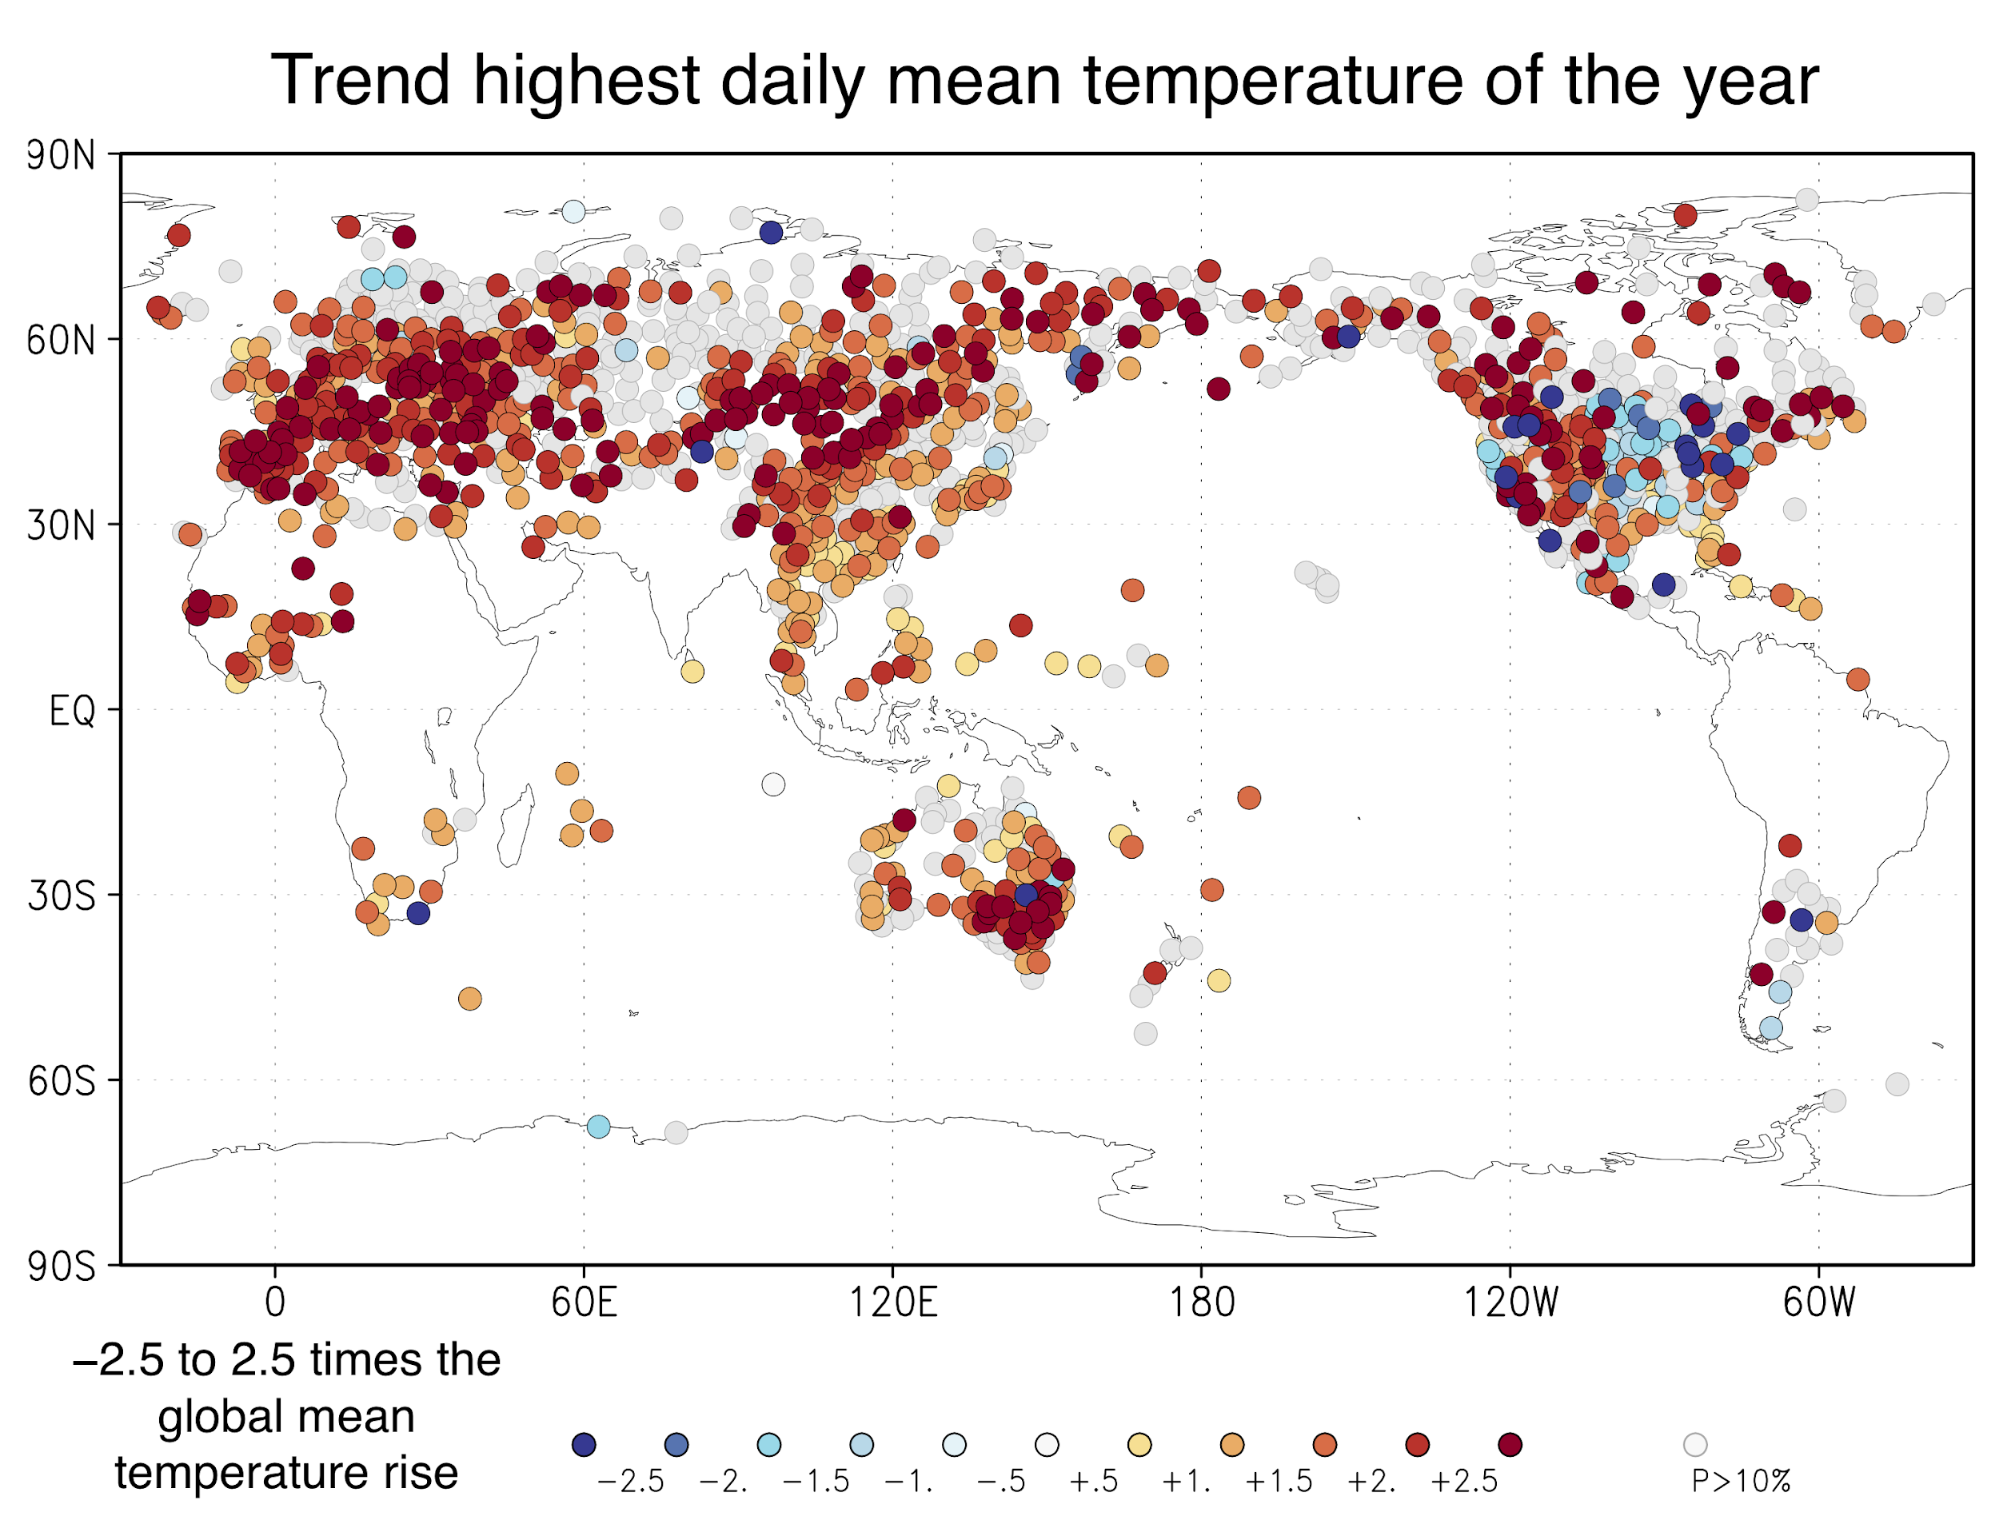
Heat waves
Let’s define a heat wave simply as the highest daily average temperature of the year here. Almost everywhere these heat waves are now warmer than a century ago. This corresponds to large increases in the probability of heat waves above a fixed threshold, as the temperature distribution usually has a thin tail or apparent upper limit. I note two exceptions: in the eastern US heat waves now are roughly as warm as they were during the Dust Bowl of the 1930s, when the severe drought heightened the temperature of hot days. In India, there has generally been no trend since the 1970s – we found that increasing air pollution and irrigation counteracted the warming trend due to greenhouse gases over that period (van Oldenborgh et al, 2018). In the rest of the world the increases are large, with the temperature of the hottest day of the year rising much faster than the global mean temperatures in most regions (values above one in Figure 1).
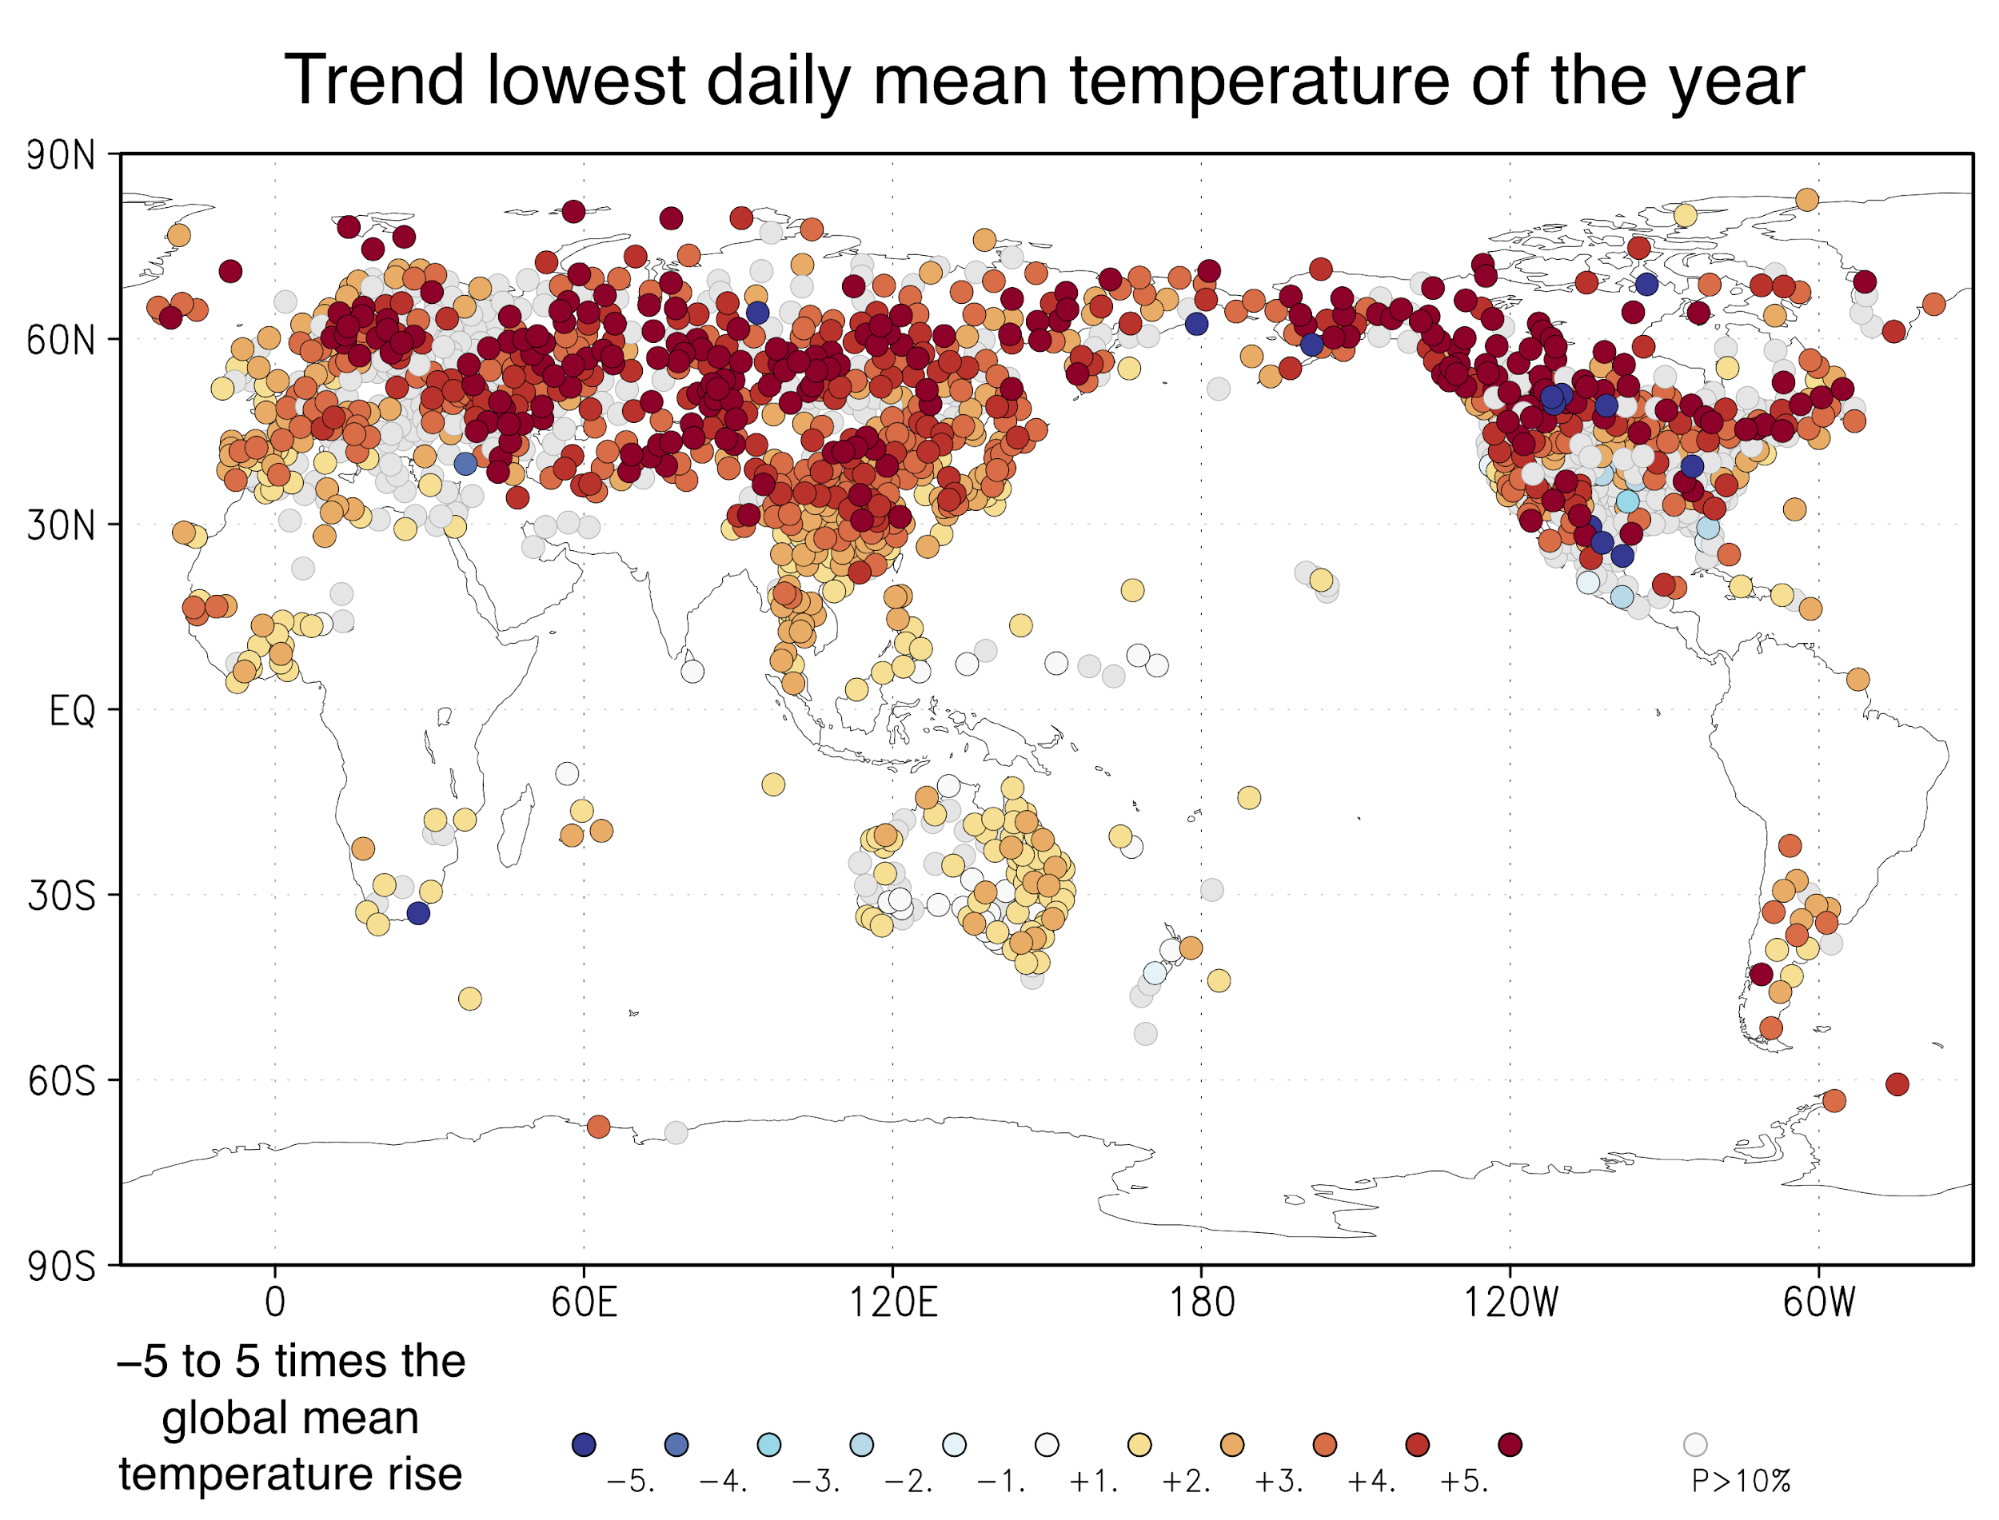
Cold waves
For this I take the daily average temperature of the coldest day of the year. Figure 2 shows that these cold waves heat up even faster than the hot extremes, up to a factor 5 times the global mean temperature (see eg van Oldenborgh et al, 2015). The strongest increases over land are in Siberia and Canada. Winter temperatures are very low there due to radiative cooling over snow under a clear sky, with strong vertical gradients in the lowest meters of the atmosphere. These stable boundary layers are sensitive to perturbations, probably also to the extra downward longwave radiation due to greenhouse warming. This may explain the strength of the observed trends. Further south, the cold air from the north is simply less cold, also due to the well-understood Arctic Amplification over the Arctic Ocean. Note that the current climate models do not have the resolution to simulate this properly and underestimate the trends.
Precipitation extremes
As a measure of extreme precipitation I take the highest daily precipitation of the year. This is relevant for local flooding – for larger basins the average time should be longer. Flash floods may be caused by shorter events. The daily sum is a useful measure in the middle of the relevant temporal range. You can make the same maps for longer times scales on the Climate Explorer. Unfortunately higher-frequency data are not yet generally available. I compute the trend of the logarithm of precipitation as this corresponds more closely with the physics and prevents negative precipitation. For small percentages these are almost the same as relative trends in the precipitation itself.
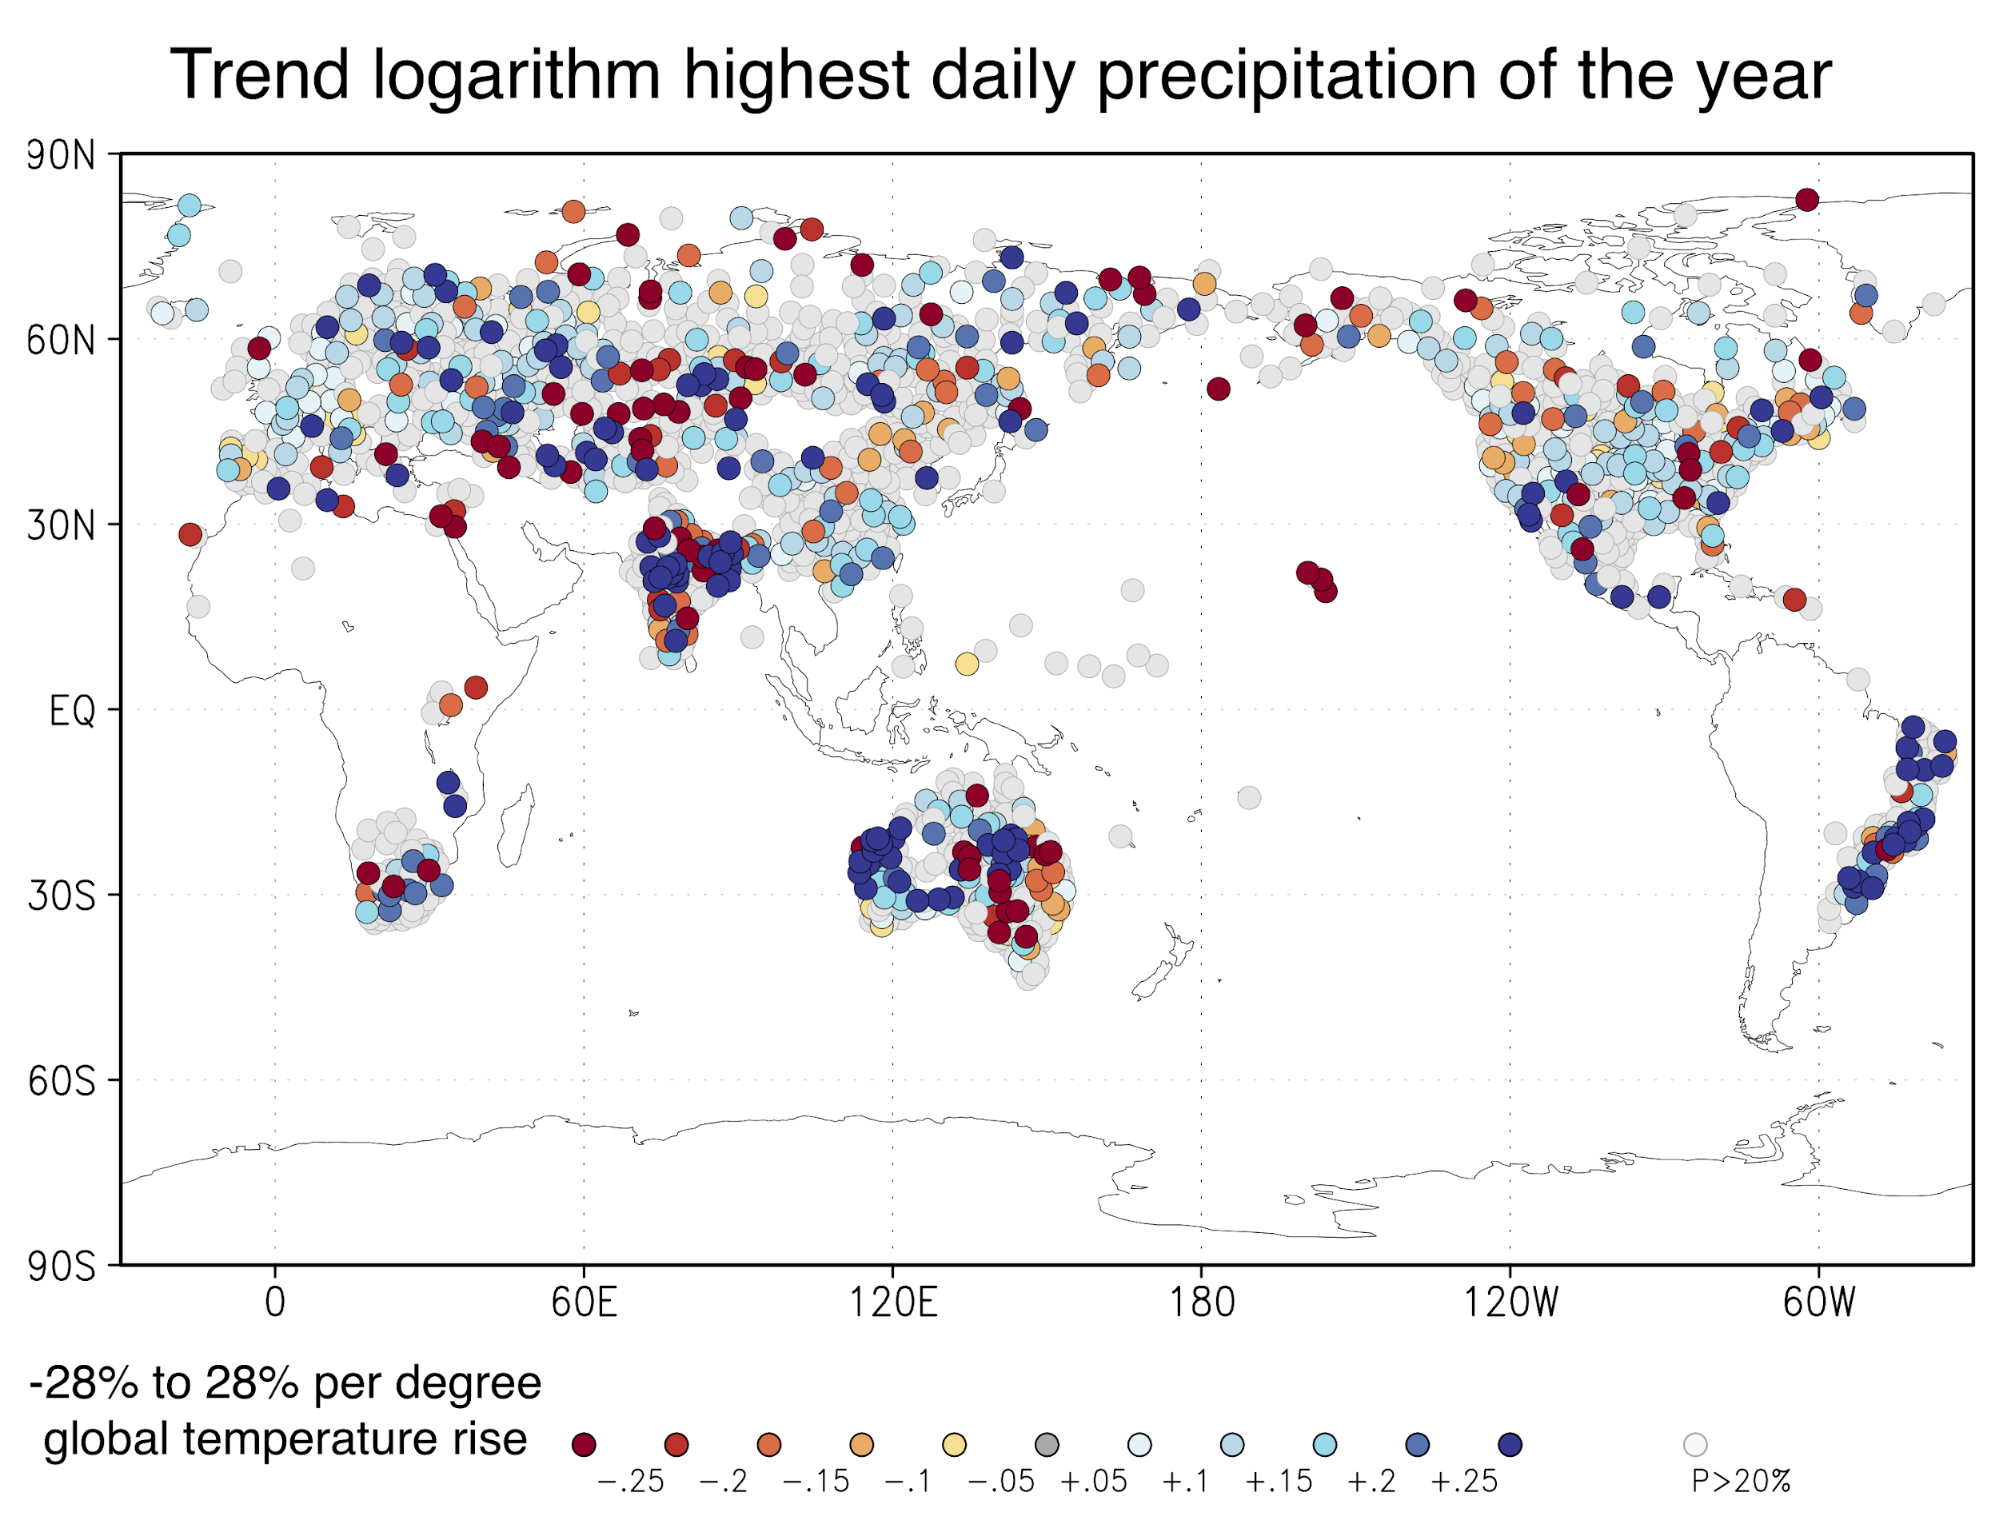
Figure 3 shows that the highest daily rainfall of the year has increased at more stations than it has decreased. This was already found by Westra et al (2013). The average increase is similar to the increase of the amount of water the atmosphere can hold at higher temperatures (the Clausius–Clapeyron relation), about 7% per degree Celsius. However, there is a large spread around this average. A large part of this is random weather: even in >50-year series the variability is large compared to the trends. In some areas there are systematic deviations from Clausius-Clapeyron due to other effects of climate change. Some examples from my own work are listed below. The trend in Colorado is lower than Clausius-Clapeyron, probably due to higher air pressure during the season of most extremes (Eden et al, 2016). Drying trends also suppress extreme precipitation, such as in summer in the Mediterranean region. However, in autumn extremes increase strongly at one mountain range there (Vautard et al, 2015). Some winter extremes in northwestern Europe are found to increase more strongly than Clausius-Clapeyron due to the increase in zonal circulation types (eg van Haren et al, 2013, Schaller et al 2016), but others do not (eg Otto et al, 2018).
To conclude, on average daily precipitation extremes increase in severity, but locally the trend often is different from the global average. We’ll be busy studying these regional trends for some time.
Tropical storms
It is hard to determine trends in the number and intensity of tropical cyclones (called hurricanes in the North Atlantic). This is because the observing system has improved so much over the last 150 years, so that more storms are detected and the most intense parts of it are more likely to be measured. There is also strong decadal variability in many regions. However, the lion’s share of damage of tropical cyclones is caused by water: extreme rain and storm surges. Both observations and modelling show that extreme precipitation of hurricanes increases strongly. For the US Gulf Coast we found an increase of about 15% over the last century (van der Wiel et al, 2017; van Oldenborgh et al, 2017, this includes non-cyclone events). Storm surges are trivially higher due to sea level rise. This means that even if the theoretically expected increase in the most intense tropical cyclones is not yet detectable, their physical impacts have increased substantially already.
Drought
Trends in drought strongly depend on the definition of drought. There are three common ones: meteorological drought, which is simply an absence of rain; agricultural drought, which is a deficit of soil moisture so includes evaporation (and sometimes irrigation); and hydrological drought, which also includes the transport of water. Trends in meteorological droughts are often hard to determine, as drought is only a problem if the variability is large relative to the mean. This implies the natural variability is also large compared to the trend (eg Philip et al, 2018). Socio-economic drought, lack of water in society, is often caused by increased consumption of water rather than decreased availability (eg Otto et al, 2015). I therefore do not dare say anything general about drought.
Conclusions
Observations of weather extremes show the expected long-term trends: almost everywhere hotter heat waves, almost everywhere less frigid cold waves, in general more intense precipitation but with a lot of variations from region to region, and more damage from hurricanes through more precipitation and higher storm surges. Other phenomena are not as simple, so more research is needed, as the customary last sentence always sounds.