On 21st June 2019, the #ShowYourStripes initiative was launched, providing ‘warming stripe’ graphics for virtually every country at showyourstripes.info.
The data was provided by Berkeley Earth and several national meteorological agencies, and the stripe graphics are available for 1901-2018 for most locations, but extended further backwards where the national data was easily available. The US States and UK regions have their own separate graphics, as do Stockholm, Oxford and Vienna – three of the longest continuous series in Europe.
Over 1 million graphics have been downloaded from the showyourstripes.info website, and many media outlets covered the story: BBC, Washington Post, Fast Company and Gizmodo.
At the same time, the #MetsUnite initiative was encouraging TV weather forecasters to use the graphics in their live broadcasts. There were at least 120 broadcasts using the graphics in 30+ countries, and other media outlets discussed it online, such as Forbes and Weather Channel.
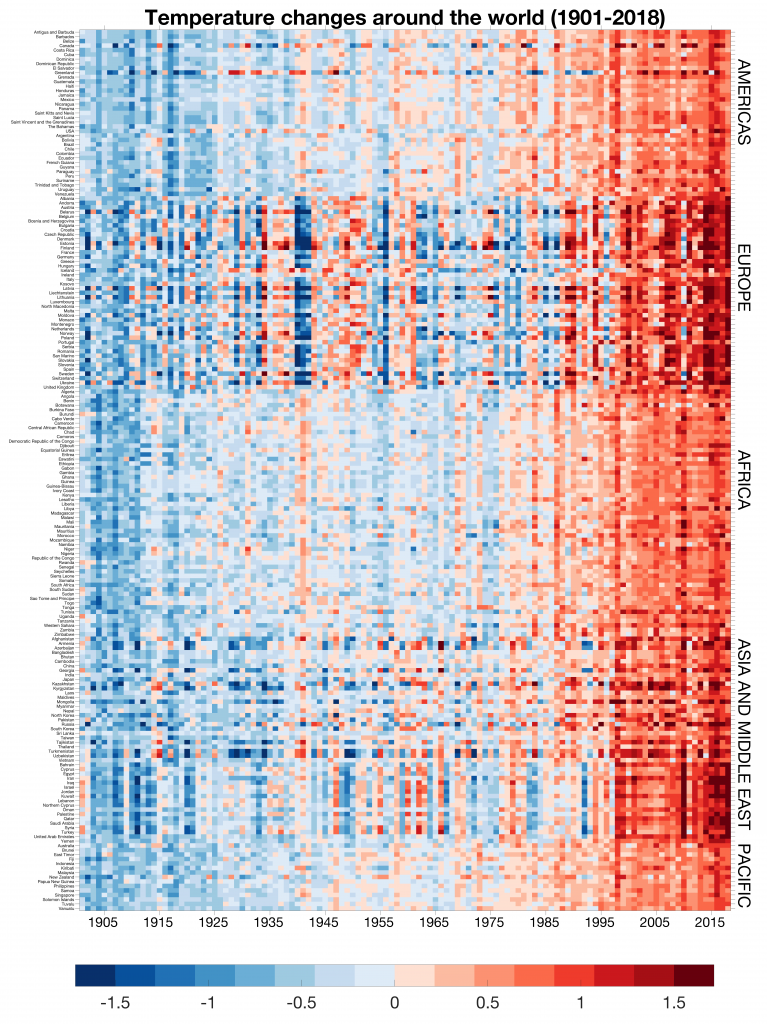
This graphic was produced specifically for the BBC article, showing every country in a single visualisation:

Thanks to: the Institute for Environmental Analytics for designing the website, Robert Rohde for providing the Berkeley data, Climate Central for encouraging the use of the graphics worldwide and Jeff Beradelli for leading the #MetsUnite initiative!
Super representation, Ed. I am going to use it. Many thanks.
Hello Mr. Hawkins:
Can you please provide me the scales used to colorize the ‘stripes’ representations? I understand that the display is primarily made to give an intuitive understanding of changes in temperature and precipitation, but I would appreciate a more quantitative understanding. For instance: with temperature, does each shade correspond to a certain range of departure from the average in degrees F or degrees C; with precipitation, is the correspondence with a range of departure in mm or inches? And if so, what are the ranges: 1 degree, 2 degrees, 5 degrees…? Or with precip: 2 mm, 5 mm; .05″, .10″, .25″…? I look forward to your reply. maleskistephen@gmail.com
All the details are given in the FAQ section of http://www.showyourstripes.info
Thanks!
Ed.
The ‘Stripes’ represent temperature variation only and do not show or represent precipitation
I’ve seen these in a few places and wondered where they came from. I’ll add a post to my website.
I love this. Potential as school poster for school based eco groups is huge