Record extreme temperature events are increasing in frequency as the climate warms. Several of these records have been surprising, in that they have been far above the previous record event for that location. Longer and earlier records, often possible through data recovery from undigitised archive material, would help quantify the risks of such record extreme temperature events. Continue reading The value of ‘data rescue’ for understanding record extremes
Category Archives: temperature
Sensitivity of historical climate simulations to uncertain aerosol forcing
Earth’s climate has warmed by approximately 0.85 degrees over the period from 1880 to 2012 [IPCC, 2013] due to anthropogenic emissions of greenhouse gases. However, the rate of warming throughout the twentieth and early twenty-first centuries has not been uniform, with periods of accelerated warming and cooling.
Guest post by Andrea Dittus
Continue reading Sensitivity of historical climate simulations to uncertain aerosol forcing
From the familiar to the unknown
Changes in climate are often analysed in terms of trends or differences over time. However, for many impacts requiring adaptation, it is the amplitude of the change (the ‘signal’) relative to the local amplitude of climate variability (the ‘noise’) which is more relevant.
We consider the ‘signal-to-noise’ ratio in observations of local temperature, highlighting that many regions are already experiencing a climate which would be ‘unknown’ by late 19th century standards. The emergence of observed temperature changes over both land and ocean is clearest in tropical regions, in contrast to the regions of largest change which are in the northern extra-tropics.
[Details in: Observed emergence of the climate change signal: from the familiar to the unknown, by Hawkins, Frame, Harrington, Joshi, Rojas & Sutton]
Continue reading From the familiar to the unknown
2019 years
The most common comment on the ‘Warming Stripes’ visualisations is: ‘what happened before 1850’?
I’m glad you asked.
Continue reading 2019 years
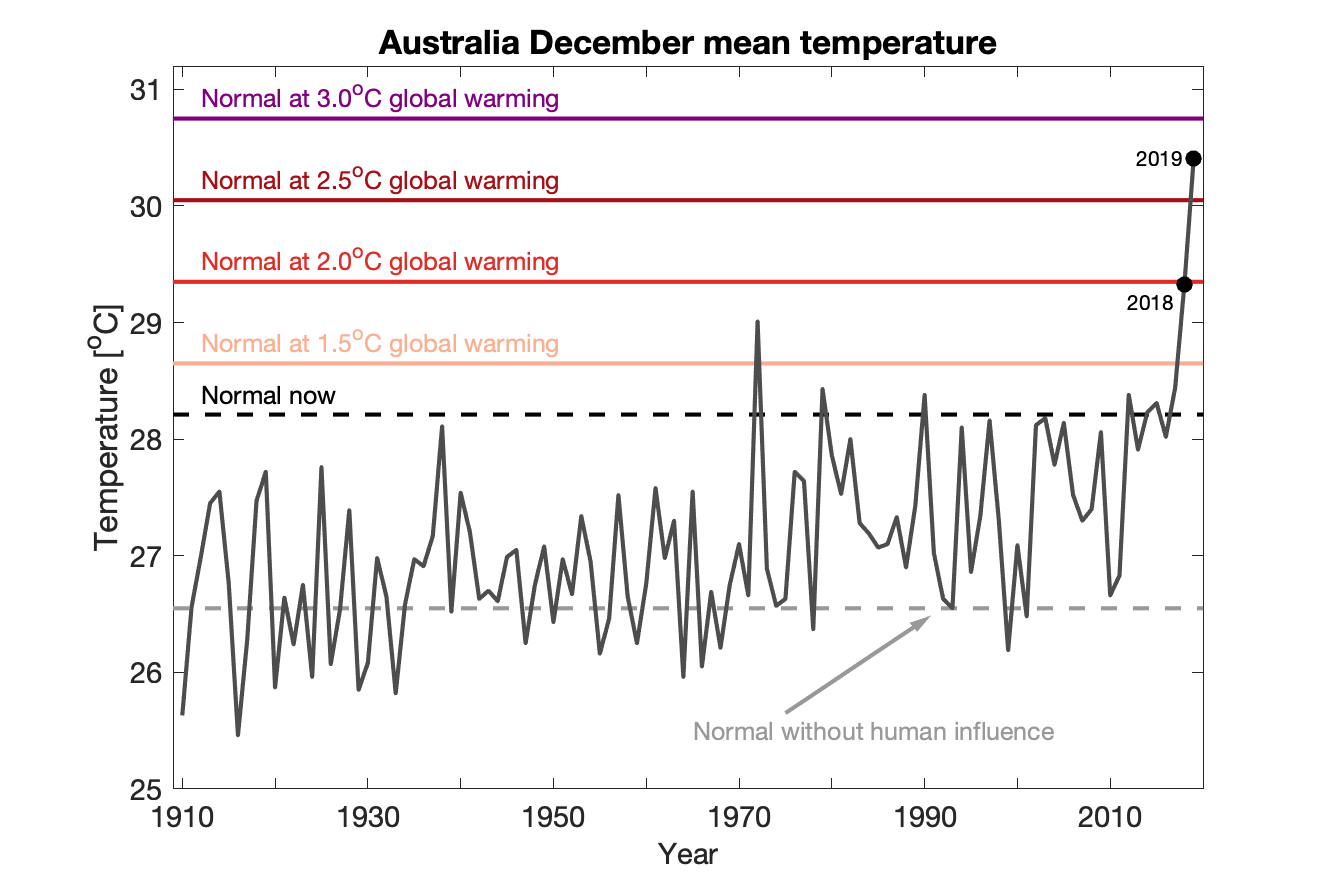
Glimpsing the future
In December 2019, the average temperature across Australia was about 2°C above what would be expected for the present-day, which is another 1.5°C above temperatures that were normal for December before humans started warming the climate. These extreme temperatures have contributed to the catastrophic bushfires which have devastated large areas.
But what may be considered ‘normal’ is constantly changing.
In a world which has warmed by 3°C – roughly the current global trajectory – what was extreme will be entirely normal.
Warming soil temperatures
It is not just air and ocean temperatures that are warming through climate change – the soils are warming too. At the University of Reading we have monitored underground temperatures every day since 1971 from 10cm to 100cm depth. There is a clear warming observed at each depth
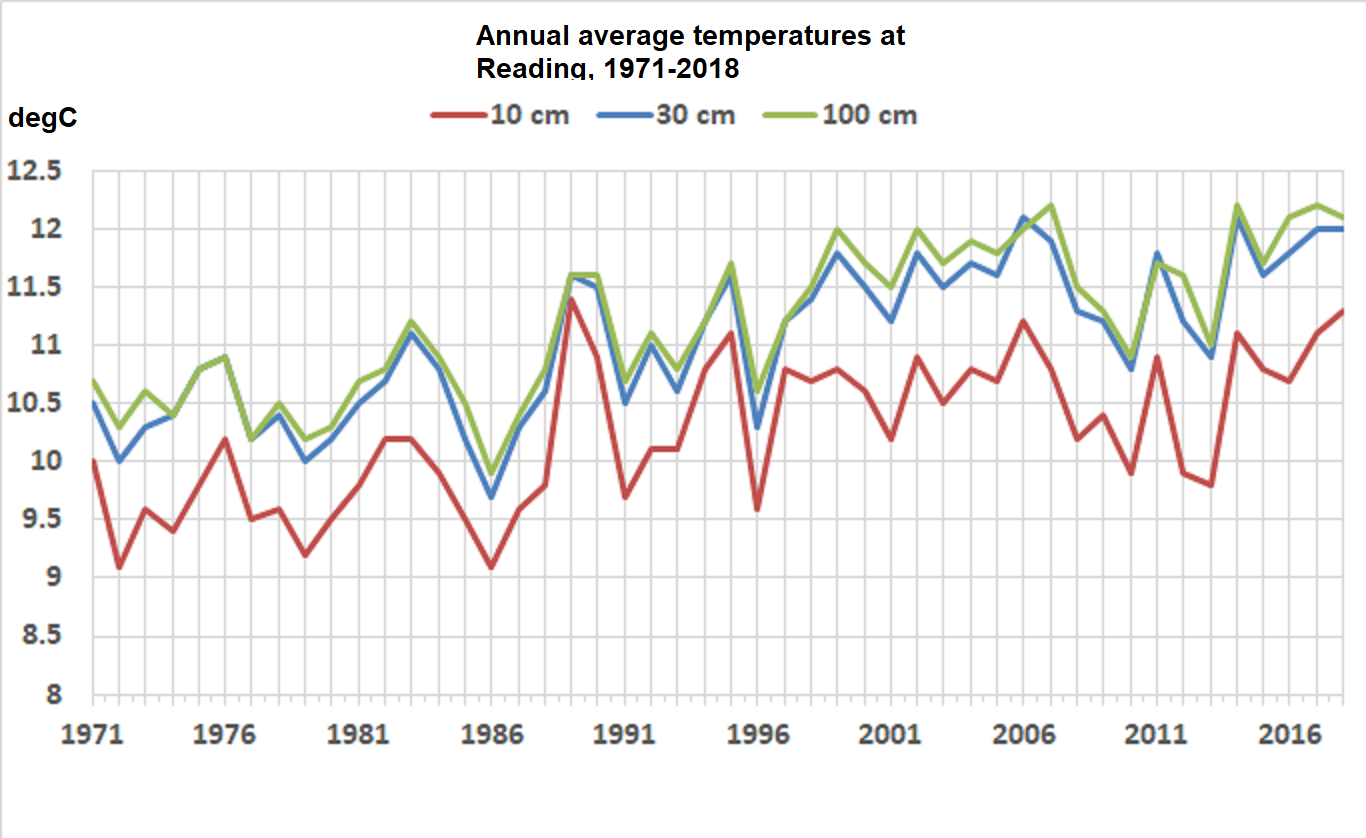
The time series for 30cm depth can be extended back further to 1941 using observations from nearby sites – Maidenhead, Hurley and an older University campus (London Road*). The variations between overlapping site records are very consistent and more than 1.5°C warming has been observed overall in the last 80 years.

(Added 12th October 2019)
Data for other depths exists also. The seasonal cycle shows how different depths respond to the seasons, with deeper depths being lagged compared to the surface and smaller variations over the year. 10cm depth is coolest in the annual average, with 50-100cm being the warmest.
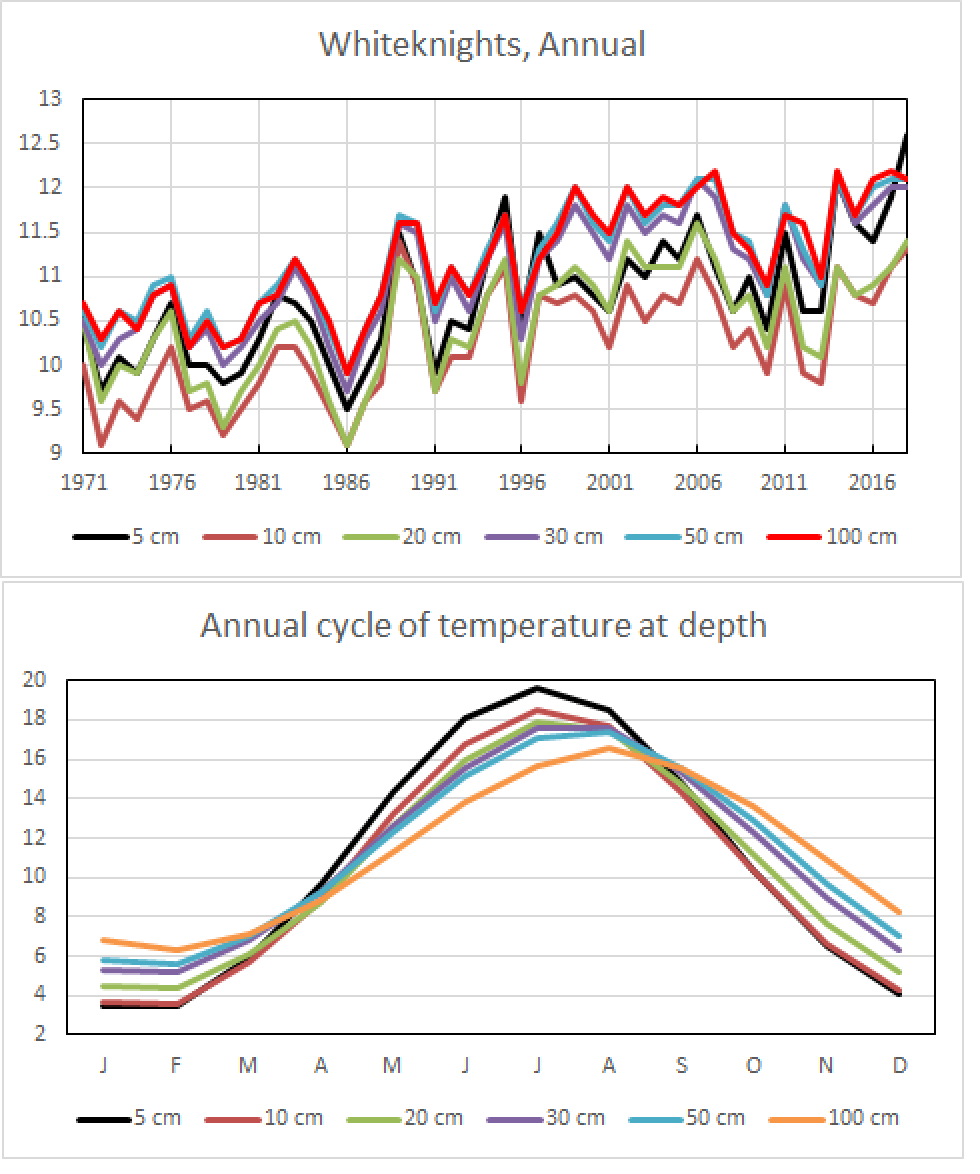
Graphics and analysis by Roger Brugge, University of Reading.
* Note the London Road campus is about 0.5°C warmer than the other sites, and this difference has been corrected for in the black line.
Atmospheric temperature trends
The lower atmosphere is warming while the upper atmosphere is cooling – a clear fingerprint of the enhanced greenhouse effect from human emissions of carbon dioxide.
The simple explanation is that some of the infrared radiation emitted by the surface, which would have normally reached the upper atmosphere, is absorbed by greenhouse gases in the lower atmosphere. The upper atmosphere therefore receives less energy than before, and so cools. The very warm years (intense reds) in the upper atmosphere are the 1982-83 El Chichón and 1991-92 Pinatubo eruptions respectively.

#ShowYourStripes
On 21st June 2019, the #ShowYourStripes initiative was launched, providing ‘warming stripe’ graphics for virtually every country at showyourstripes.info.
The data was provided by Berkeley Earth and several national meteorological agencies, and the stripe graphics are available for 1901-2018 for most locations, but extended further backwards where the national data was easily available. The US States and UK regions have their own separate graphics, as do Stockholm, Oxford and Vienna – three of the longest continuous series in Europe.
Over 1 million graphics have been downloaded from the showyourstripes.info website, and many media outlets covered the story: BBC, Washington Post, Fast Company and Gizmodo. Continue reading #ShowYourStripes