Record extreme temperature events are increasing in frequency as the climate warms. Several of these records have been surprising, in that they have been far above the previous record event for that location. Longer and earlier records, often possible through data recovery from undigitised archive material, would help quantify the risks of such record extreme temperature events. Continue reading The value of ‘data rescue’ for understanding record extremes
Category Archives: extremes
Storm Ulysses
On 27th February 1903 a major windstorm hit the UK and Ireland, known as Storm Ulysses.
The 20th Century Reanalysis (20CRv3) includes a modern reconstruction of the storm, created by assimilating available observations of surface pressure into a state-of-the-art weather forecast model.
There is a problem however. The number of available observations over north-west Europe is limited as most have never been digitised from the original hand-written paper sources. Recently, the WeatherRescue.org project rescued millions of observations, allowing us to examine the value of this new data by rerunning 20CRv3 with the new data added.
Continue reading Storm Ulysses
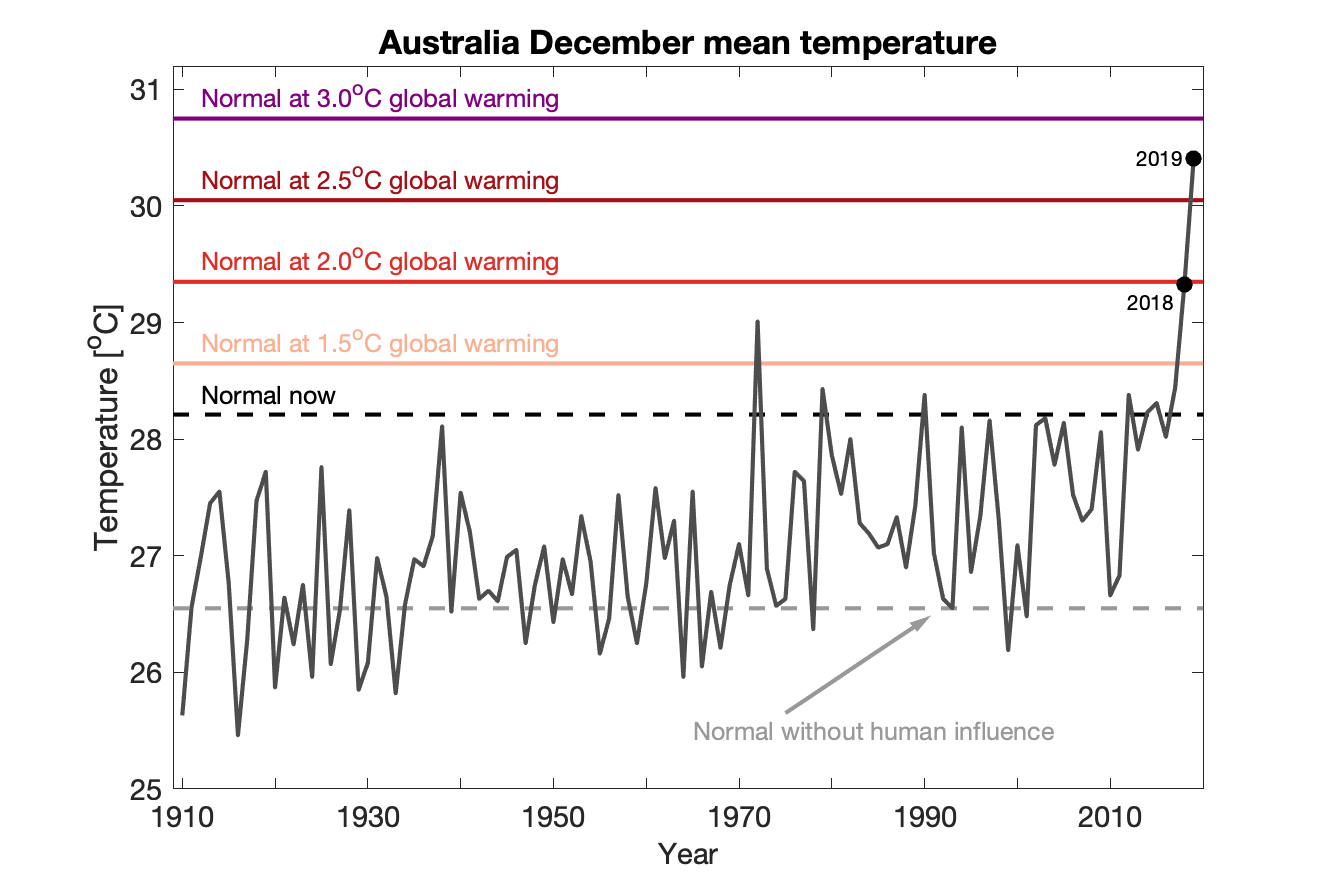
Glimpsing the future
In December 2019, the average temperature across Australia was about 2°C above what would be expected for the present-day, which is another 1.5°C above temperatures that were normal for December before humans started warming the climate. These extreme temperatures have contributed to the catastrophic bushfires which have devastated large areas.
But what may be considered ‘normal’ is constantly changing.
In a world which has warmed by 3°C – roughly the current global trajectory – what was extreme will be entirely normal.
Trends in extremes
Twenty years ago, the trend in annual mean global mean temperature became detectable. Ten years ago, regional seasonal mean temperature trends were becoming clear. Nowadays, we can see trends even in weather extremes. In this post I show trends in long-term meteorological station data for hot, cold and wet extremes, and share some thoughts on tropical cyclones and droughts. It is underpinned by a decade of studying these around the globe, often in collaboration with the WWA team. I make no claims for completeness: the world is large and complicated, and I simply do not know all the literature.
Guest post by Geert Jan van Oldenborgh
Continue reading Trends in extremes
Changing wet and dry seasons
The fickle nature of weather patterns is ultimately responsible for the where and when of tropical rainfall extremes which wreak damage on agriculture, infrastructure and people. Tropical cyclones, such as Enawo which battered Madagascar in March, can severely impact low-lying, highly populated regions through intense rainfall combined with strong winds and storm surges. Explosive thunderstorms operating at smaller spatial scales can generate flash flooding and may lead to devastating landslides in mountainous terrain. A sustained dearth of rainfall or multiple failed seasonal rains, as implicated in drought currently impacting Somalia, Kenya and Ethiopia, are also inextricably linked with evolving weather patterns, often driven by the slower heart-beat of the oceans as they pace out the internal rhythm of El Niño Southern Oscillation and its decadal counterparts. Continue reading Changing wet and dry seasons
Rapid increase in heat extremes in Europe
In the last few decades, Europe has warmed not only faster than the global average, but also faster than expected from anthropogenic greenhouse gas increases (van Oldenborgh et al., 2009). With the warming, Europe experienced record-breaking heat waves and extreme temperatures, such as the 2003 European heatwave, 2010 Russian heatwave, and 2015 European heatwave, which imposed disastrous impacts on individuals and society. Continue reading Rapid increase in heat extremes in Europe
How to quantify changes in climate extremes without inducing artefacts?
Much evidence has accumulated that temperature extremes and variability are changing. Accurately diagnosing such changes is of vital societal interest, not least because human induced climate change is often expected to materialise primarily through changes in the extreme tails.
Quantifying these features of climate time series statistically in climate models and observations is not straightforward. To a large extent, that is because extreme events are rare by definition, a fact that seems hardly surprising. This fact implies, however, that conventional methods quickly break down when it comes to the tails. This blog post serves s a cautionary note, in which we discuss how apparently very simple methods can result in severely biased estimates, and how this can be avoided1,2.
Guest post by Sebastian Sippel, MPIB, based on Sippel et al. (2015) Continue reading How to quantify changes in climate extremes without inducing artefacts?
Extremes of 2014 in review
Was last year really the warmest on record? As soon as NOAA published its official announcement in January, this question invaded the web feeding blogs, online newspapers and forums with passionate discussions. Relevant or pointless? The question is not so much knowing whether or not a new record was broken. Should 2014 rank second or third, this wouldn’t change the big picture: last year, temperatures on our planet continued the existing long-term positive trend. On top of that, the story is a bit thicker than the one single number obtained when averaging near-surface air temperatures in time and space. So, 2014: year of extremes or warm year in a changing climate?
Guest post by François Massonnet, Université Catholique de Louvain, Belgium / Catalan Institute of Climate Sciences, Spain Continue reading Extremes of 2014 in review