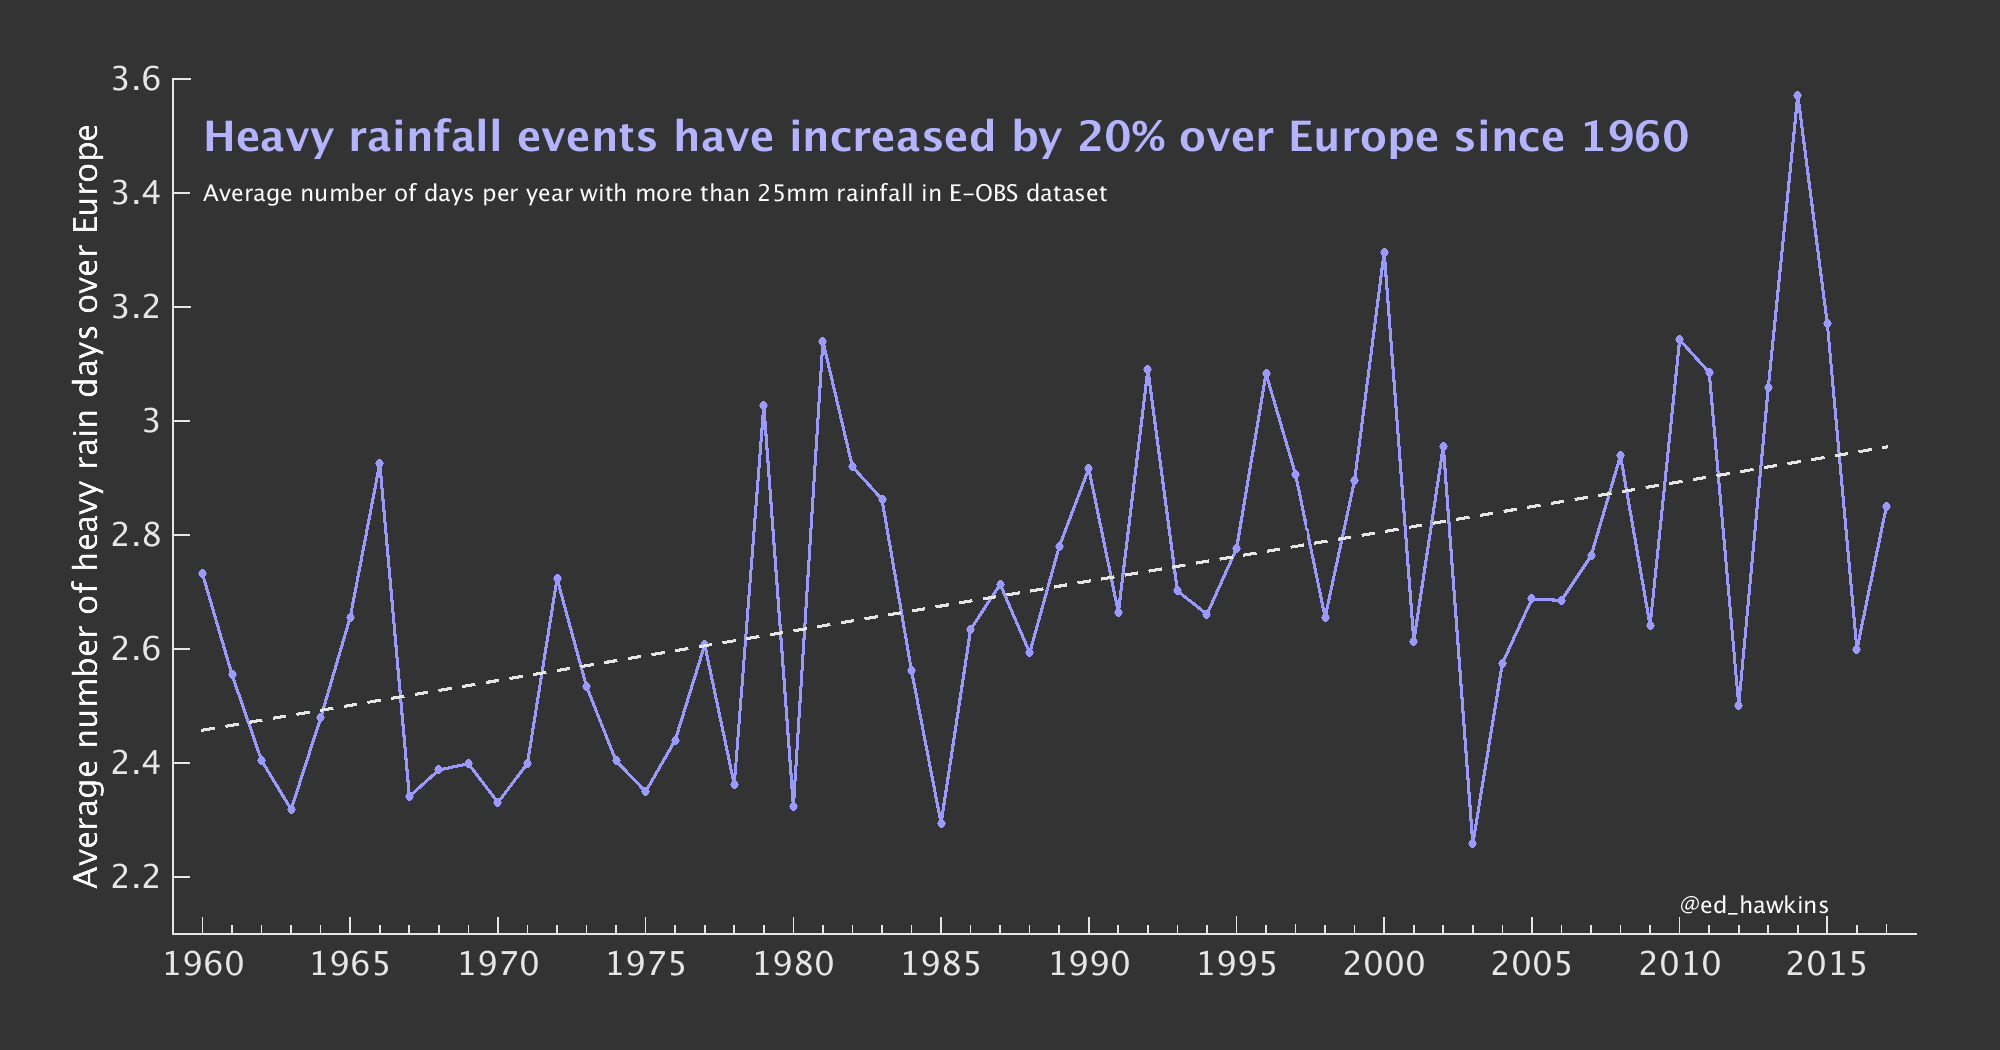
Data: E-OBS v17 gridded rainfall dataset. Calculated as the number of gridpoints per calendar year with daily rainfall amounts over 25mm, divided by the number of gridpoints.
Data: E-OBS v17 gridded rainfall dataset. Calculated as the number of gridpoints per calendar year with daily rainfall amounts over 25mm, divided by the number of gridpoints.
The study by Ntegeka and Willems ten years ago is interesting in that the authors examine 108 years of rainfall records for a site in Belgium (recorded every 10 minutes!).
They found large variability through time, with significant deviations which persisted for periods of 10 to 15 years.
They found extremes “clustered in the 1910s–1920s, the 1960s and recently in the 1990s.” In conclusion, the “temporal clustering highlights the difficulty of attributing ‘change’ in climate series to anthropogenically induced global warming.”
Trends and multidecadal oscillations in rainfall extremes, based on a more than 100-year time series of 10 min rainfall intensities at Uccle, Belgium
https://agupubs.onlinelibrary.wiley.com/doi/full/10.1029/2007WR006471
So a study done 10 years ago using a single site says what, exactly, about this observation aggregating 100s of sites?
It probably doesn’t change the results that much, but wouldn’t be better to weight each gridpoint by cos(lat) to account for varying areal representation?
Not sure this the exact dataset used but it seems that’s been thought of in this context. A web search finds the first PDF linked from https://www.ecad.eu/download/ensembles/ensembles.php
“[ 25 ] The monthly means or totals were then interpolated
with thin-plate splines using elevation to a high resolution
0.1° by 0.1° rotated pole grid, with the ‘‘North Pole’’ at
162°W, 39.25°N. We chose to use a rotated pole grid so as
to allow quasi-equal area grid spacing over the study region.
…
Using an unrotated grid would have
resulted in a higher grid density in the north of the region
compared to the south.”
“So a study done 10 years ago using a single site says what, exactly, about this observation aggregating 100s of sites?”
It adds a much longer time perspective, showing multi-decade swings in extreme precipitation events.
“It adds a much longer time perspective, showing multi-decade swings in extreme precipitation events.”
Unless I’m mistaken, the “multi-decade” period on the graph above is 50 plus years, and the long term “swing” is all up. Talking about swings over one or two decade periods earlier in the century, at one spot, seems of limited relevance, if you ask me…
What was the data before 1961? We do have weather data in the UK before that. The heavy rain change in 50 years doesn’t really seem very significant.
Are there more plots that show thresholds other than 25 mm? I’m interested to see how it compares to changes in 10 mm – days and points in between. Perhaps you could show a surface plot?