Recent media headlines have again discussed the issue of whether climate models are overly sensitive to greenhouse gases. These headlines have misinterpreted a study by Millar et al. which was discussing carbon budgets to limit global temperature rise to 1.5°C above pre-industrial levels.
A recent study by Medhaug et al. analysed the issue of how the models have performed against recent observations at length and largely reconciled the issue. An overly simplistic comparison of simulated global temperatures and observations might suggest that the models were warming too much, but this would be wrong for a number of reasons.
In the Medhaug et al. paper they show the range of models (blue shading in figure with median in light blue), compared with the HadCRUT4 observations and their estimated uncertainty (orange shading with light orange line). There are a number of well understood reasons why the light orange line might not follow the light blue line, namely: radiative forcings, variability, observational biases and choice of reference period.
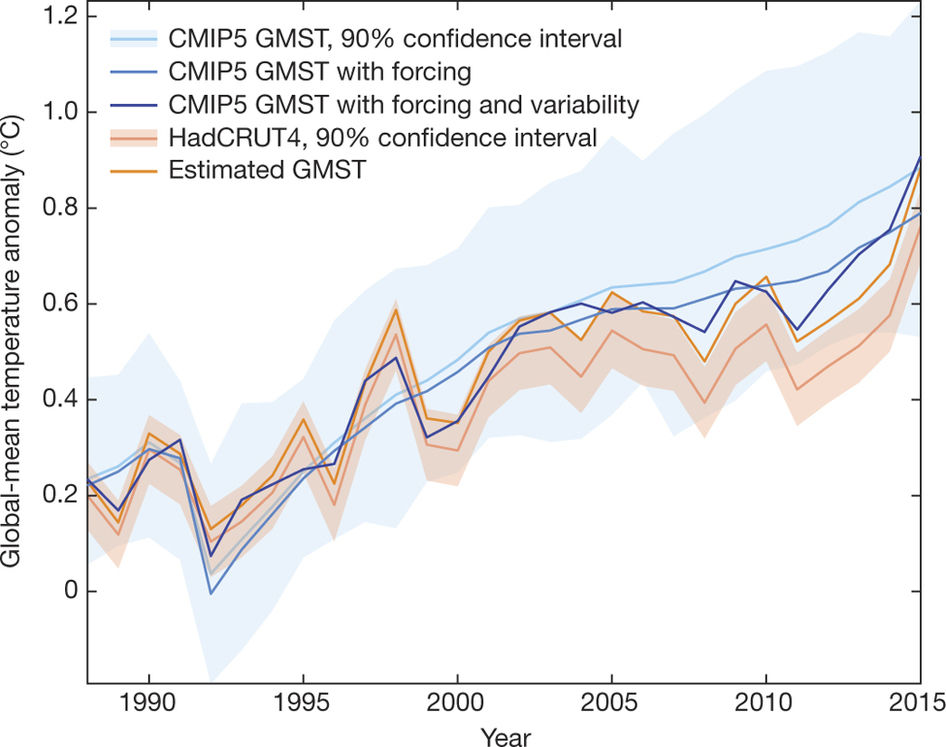
Radiative forcings: The simulations were produced using observed information on sources of radiative forcing up to 2005, and made various assumptions for subsequent forcings. For example, the simulations assumed no volcanic eruptions after 2005, whereas the real world did have some eruptions. In addition, the sun dimmed slightly and this was not included. Retrospectively we can estimate the effects of these assumptions on the simulations, and this moves the light blue line to the mid-blue line. In other words, if the models had known about future forcings they would have been closer to the observations.
Variability: It is also understood that natural fluctuations in the climate (e.g. ENSO, PDO) can temporarily offset or enhance the warming during certain periods. These effects can also be accounted for, producing the dark blue line. In other words, if the models had produced the same phase of variability as the real world then, again, they would have been closer to the observations.
Observational biases: We also understand that our observations are not perfect. The HadCRUT4 dataset has relatively few observations over the Arctic and also uses sea-surface temperatures over the ocean, whereas the model analysis uses simulated air temperatures everywhere. Accounting for these issues moves the observations warmer, to the dark orange line. In other words, in an ‘apples-with-apples’ comparison, the observations and models are closer together.
When accounting for these three factors together, the dark blue and dark orange lines now show a very similar warming trend – the models and observations have been reconciled and there is no clear evidence from the recent period that the models are therefore ‘running too hot’. About 1/3 of the apparent discrepancies are due to each of these three factors.
Choice of baseline: One further subtlety is the choice of ‘baseline’. Medhaug et al used a 1961-90 reference period, whereas the IPCC AR5 chose 1986-2005. This difference can also slightly move the relative position of the observations within the model spread higher or lower. There is no perfect choice.
I’m not sure ‘misinterpreted’ is correct. The news articles had a different emphasis than the Nature paper, but the paper’s authors are quoted. For example:
Myles Allen, professor of geosystem science at the University of Oxford and one of the study’s authors told The Times: “We haven’t seen that rapid acceleration in warming after 2000 that we see in the models. We haven’t seen that in the observations.”
and
According to The Times, another of the paper’s authors, Michael Grubb, a professor of international energy and climate change at University College London, admitted his earlier forecasting models had overplayed how temperatures would rise.
and
Pierre Friedlingstein, another author of the study and a professor at the University of Exeter in the United Kingdom, added at the news briefing that “the models end up with a warming which is larger than the observed warming for the current emissions. … So, therefore, they derive a budget which is much lower.”
Yes, it seems that Myles Allen misinterpreted his own paper.
Myles’ quote in the Times, which has been picked up everywhere, is about a topic which isn’t discussed in the paper. And, it is wrong – the models don’t actually show a rapid acceleration post-2000: from an old post
Ed.
The PDO has been positive for a record number of months in a row (may go negative when the August 2017 number comes out.) During this powerful surge in the PDO the GMST has gone way up: aggressively so. In 2016 there was a La Niña that barely cooled the GMST at all. The 2010 – 2012 La Niña events, which were accompanied by a strongly negative PDO, caused a major dip in the GMST, and that was close on the heels of the 2007-2008 La Niña, which did the same thing.
It just seems like a ridiculous time to be claiming models are running hot. What the PDO will do next is unknown, but it could easily surge again, which could rapidly send the GMST to new heights by 2020.
Firstly there are no real direct observations of radiative forcing. There are just observed measurements of CO2 concentrations , and estimates of CH4 and aerosols. Models are used to derive radiative forcing from this. The above argument is kind of cheating, because it uses the benefit of hindsight to adjust model forcings so as to better match the known temperature data. All models have been very good at hind-casting for exactly this reason.
[I have tweaked the text – we observe the sources of forcing – Ed.]
A model should be able to predict (project if you prefer) future warming, otherwise they should be modified or rejected. I would argue that the data already selects those models and parameters with low climate sensitivity irrespective of volcanic eruptions, natural variations etc.
Model democracy has to come to an end. Not all models are equal. They cannnot all describe nature.
http://clivebest.com/blog/wp-content/uploads/2015/10/Yearly-compare.png
Clive – I have given several reasons above why the models should not precisely match the observations. There are also numerous reasons why using the observations to constrain TCR may be biased too. It’s not as simple as you appear to think.
Ed.
Thanks Ed,
I understand the three arguments described above which tend to move the models closer to observations. The apples to apples comparison is a sound argument IMHO. However, adjusting Radiative Forcing and variability with the benefit of hindsight is in my opinion more suspect. If you apply PDO,AMO and ENSO to models post 1988, then you should really also apply them pre-1988. In this case the previously good agreement between “hind-cast” models and data will be lost. The 60y AMO oscillation is clearly evident right back to 1850.
Perhaps one day you could do a post on Radiative Forcing, because I think this is a misunderstood and misused term. In reality RF is just the energy imbalance between incoming solar radiation and outgoing IR radiation. An increase in Aerosols reduces solar radiation, while an increase in CO2 reduces IR radiation. Both have to be calculated.
Now suppose you have an ensemble of earth’s, all of which are experiencing the same net increase in forcing. Are you saying that the spread in ‘earth’ temperature responses would be the same as those in the models? If not then one model with one set of parameters will give the best fit to all such earth’s. This is the best description of the climate.
There are plenty of theorists in other branches of physics who have spent years developing models which turn out to be wrong. I don’t see why climate science should be a special case.
@-CB
“There are plenty of theorists in other branches of physics who have spent years developing models which turn out to be wrong.”
Can you give examples, I can think of no other case of physical modelling developed by a consensus all the theorists in a field, that has turned out to be wrong. I don’t see why climate science should be a special case.
High Energy Physics .
1. Technicolor
2. Regge theory of strong interactions (1960s)
3. Supersymmetry?
Hi Clive,
What makes you think applying a similar variability analysis pre-1988 will mean the agreement is lost? Xie and Kosaka demonstrated that constraining simulations with Pacific SSTs improves the global match throughout the 20th century: http://www.nature.com/ngeo/journal/v9/n9/full/ngeo2770.html
As for examining the radiative forcings – presumably you would agree that if an enormous volcano had erupted in 2010 then we would not have expected the CMIP5 simulations and observations to match? Same principle for smaller eruptions and solar changes. It is important to remove all other reasons why the models and observations might disagree if we want to better understand the climate sensitivity issue. I know that many groups will soon run their CMIP5 models with updated CMIP6 forcings which will include the small eruptions and solar changes – this will give a much better estimate of their effect.
And, remember, all models are wrong Clive, but some are still useful! 😉
Ed.
How do you ‘measure’ the radiative forcing of a volcano – small or large?
You may call me a cynic but I put it to you that both ‘volcanic forcing’ and ‘aerosols’ are actually fine tuned so that models then match the actual temperature shortfall.
“And, remember, all models are wrong Clive, but some are still useful!”
As Dr. Judith Curry observes, IPCC climate models are not fit (useful) for fundamentally altering our society, economy and energy systems, Ed. Tuning models, in both hindcast and “modified forecast,” does not assist one in deciding their validity. Accurate forecasts would be needed to justify spending trillions.
Just looking at the lines on your graph, other than for the Super El Nino the 21st Century has not warmed appreciably, even for your “modified” history measurements.
I agree with Clive. Model runs are, after all, produced by assuming emission scenarios. That is, they do ‘know’ about future forcings. A second point is that the global average oscillates around the model mean in the hindcast period whereas its value fails to touch the model mean for 2015, indicating the models failed to predict the pause. After all, using the model 90% envelope to emphasize predictive skill is an admission of failure as the envelope is so wide, taking up close to 50% of the temperature range on the anomaly axis. How low does the global average need to go to fall out of prediction?
Clive
It is good to see you come to your senses about the apples to apples comparison
I was kinda wondering why you fought with me against this approach on twitter.
Adjusting for Radiative forcing changes. This is standard procedure in
any type of modelling effort where you cannot control the conditions of
the test. When the simulations are run you have to make certain projections
of what you think the test conditions will be. You assume various forcing pathways: 2.6,4.5, ect. You cant control these. In fact you are pretty certain that
reality will NOT cooperate with your projections. We face this all the time in
simulation. If the simulation is cheap you just run a wide variety of possible
futures ( known as sensitivity runs) If the simulation is expensive you can
either rerun after the fact or adjust the results and re run later.
For example. All models ( last I checked) assumed a solar constant beyond
2005. That means IF the actual TSI value was lower than this we can expect
even PREDICT that the bias will be a warming one. If the actual TSI is greater
we can predict a model cool bias. Same with Volcanos. The tests are run under an
assumption of no volcano. Should one occur, you can of course ( down the road)
re run the simulations. OR you can adjust the results, predict what your models would have output and THEN re run with the actual data, testing both your model
and your de Biasing.
How do you adjust the results? That too is pretty simple. Short runs of the
simulation or even simple first order estimates of the unforeseen effect
can give you an adjustment basis. Adjustments need not be perfect. They
only need to reduce the bias. And then you re run to test your adjustment
approach. Standard approach. Not rocket science.
When CMIP6 finishes you end up with the best approach, simulations are
re run and post 2005 forcing data is actual rather than projected. And then
you are also able to judge various de biasing efforts that folks have done
in between the large efforts.
its like this:
You have to project forcing. Its unknown.
You have to assume certain parameters (like volcanos) are constant.
You run your test.
the answers WILL ALWAYS diverge from reality. Thats why we call them models.
You then investigate
A) Are the observations accurate?
B) We assumed certain variables would be constant? were they?
C) We projected certain forcing futures, how close did we come?
Then you hypothesize again, de biasing
A) How much of the discrepancy can be due to forcing projection errors
B) How much of the discrepancy can be do to observational bias
C) How much of the discrepancy can be due to errors in “constants”
changing.
Then you test again — CMIP6
in normal science this exercise of making projections, assuming some constants, running experiments, correcting for bias, and re running, is non controversial.
Steve,
That is a very long winded way of saying that
1. We can measure TSI and adjust for it aposteriori. I agree that’s OK.
2. We can’t measure volcanic forcing. So everybody simply fudges the forcing so as to match the reduce (negative) temperature response. This is not OK.
#2 is simply not true Clive. Have a read about how the volcanic forcings are implemented.
Ed.
Nearly 20 million tons of sulfur dioxide were injected into the stratosphere in Pinatubo’s 1991 eruptions, and dispersal of this gas cloud around the world caused global temperatures to drop temporarily (1991 through 1993) by about 1°F (0.5°C).
Right, so how is that implemented in the models?
Ed.
What I really mean is that models are tuned to reproduce the observed Pinatubo 0.5C drop in temperature i.e.they were calibrated against the paleoclimate record. It is not something that is derived from first principles.
Clive – that is simply incorrect. Do you have evidence for that assertion? Have you seen the range of responses to Pinatubo in CMIP5? Tuning would be a bad idea anyway as there is a simultaneous El Nino which confuses how much cooling is due to the volcano. It’s not derived from first principles either but have you read about how the volcanoes are implemented in the models yet?
i do think its naive to assume that aerosol forcings aren’t “tuned.” They are sub grid models with lots of parameters. in general aerosol forcing estimates from first principles have been falling over the last decade and its not clear that GCM’s are getting values that are physically reasonable. It there is a paper on this, I’d appreciate seeing it.
Of course the parameters are ‘tuned’, but usually this is done using the recent mean climate state, not the historical record. Recent paper by Schmidt et al on this topic:
https://www.geosci-model-dev-discuss.net/gmd-2017-30/gmd-2017-30.pdf
Ed.
In the Sunday Times yesterday
Climate change predictions — what went wrong?
Climate scientists have admitted their estimates of global warming were wrong. So can we all chill out now? Not quite
As egg-on-face moments go, it was a double-yolker. Last week a group of climate scientists published a paper that admitted the estimates of global warming used for years to torture the world’s conscience and justify massive spending on non-carbon energy sources were, er, wrong.
Being wrong is not a criminal offence, especially in science, where in the long run almost everything turns out to be wrong, but the global warmers have adopted such a high-and-mighty tone to anyone who questions them that for sceptics this was pure joy.
I wouldn’t believe everything you read in the Sunday Times (or any newspaper)!
Ed.
Ed, I do not know how sulphate effects are implemented in the models but I assume they are not derived from actual photon scattering by individual molecules modeled at the atomic level. Would I be correct? Anything less than this would mean their effect is not derived from first principles.
If you read my reply to Clive, I agreed it’s not done from ‘first principles’. But also the models are not tuned to give the ‘correct’ response to Pinatubo as Clive is claiming.
Ed,
So please tell us how Volcanoes are simulated in the models. Satellites can provide real-time dependent data about the extent and thickness of the SO2 cloud. Models could then use Rayleigh scattering to calculate how much incoming solar radiation is scattered, and how much is reflected back to space etc. This will evolve with time and latitude, and it would result in a zonal change in incident solar heating. Models could then integrate all this into daily energy balance calculations with greenhouse gases, other aanthropogenic aerosols etc.
Or do they just use some kind of global parameterisation (fudge factor) ?
Something like S = S0 (1- V*exp(-bt))
2. We can’t measure volcanic forcing. So everybody simply fudges the forcing so as to match the reduce (negative) temperature response. This is not OK.
That’s not how it works.
You have an concentration input file that has volcanic aerosols.
The physics calculates the effect.
You run with and without these concentrations.
That gives you an estimate of the effect.
This Estimate Can Be Used To Bias Adjust Your projection.
Then you run with the actual concentrations.
Right now a volcano is brewing in Bali.
A very famous volcano that was the basis of Hansen
Masters thesis and later a paper showing how the effects
Could be modelled.
Read it.
Bias adjustments for volcanoes you cannot predict is straightforward AND testable.
Looking at the graph, it’s obvious that the 21st century has warmed appreciably despite some unusually strong La Niña events and an often negative PDO index. It’s rather amazing that a little trace gas came off the bench in then 9th inning and knocked the cover off the ball like that!
A trace of a dollar is not much, but a trace of a trillion dollars can be a nice sum. I read that consuming a gallon of gasoline produces about 20 pounds of carbon dioxide, more than I would have originally thought, but it made sense when I realized hydrogen on a hydrocarbon is being replaced by oxygen. I wonder what’s in store for the 18th Inning.
Of course the models are running too hot. Its clear from figure 1a from Medhaug et al. during 1951-2012. Maybe + 0,15 °C/per decade versus + 0,11, a good 33% too hot.
Data post 2005 can’t change that much.
So you could simply respond to your title by “Yes they are”. Feel free to add a “, but…” after
If Figure 5 suffer from non “perfect choice” that lead to show no discrepancy between models versus reality, then throw it into the bin.
“Are the models “running too hot”?
The answer is yes with respect to carbon emissions.
http://clivebest.com/blog/?p=8059
Good discussion.
To sum up:
Ed answered the question, “Are models running hot?” with the answer,
“No, because the the following reasons”.
What he should have said was,
“Yes, because the the following reasons”.