In the Paris climate agreement it was agreed to limit global warming to well below 2 degrees Celsius and to drive efforts to limit the temperature increase even further to 1.5 degrees Celsius above pre-industrial levels. There has been a debate whether the ambitious climate change mitigation goal of 1.5 °C is still within reach. This was fueled by a paper by Millar et al (NGS, 2017), which claimed there was still a reasonable carbon budget left to reach this very ambitious goal. Others claim this is already physically impossible. We try to find out why they reach different conclusions. Two factors are important: definitions and cancellations of temperature trends after fossil CO2 emissions would cease. A similar discussion with other emphasis has been written by the authors of Millar et al. It is all about tenths of degrees.
Guest post by Geert Jan van Oldenborgh, Michiel van Weele, Rob van Dorland (KNMI)
Definitions
The new aspect of Millar et al is to take the warming and emissions up to now from observations, not models, and use the models only for the future. This method was also used in the IPCC WG1 AR5 report Chapter 11, to estimate near-term warming more accurately. It reduces the model uncertainty because the models are used over a smaller warming interval. However, the result depends critically on a few definitions that differ between the analyses of Millar et al and those of others. As far as we know these terms were not defined in the Paris accord, leaving room for different interpretations.
Definition of “pre-industrial”
Millar et al use a baseline of 1861–1880, which has the advantage that there were already a few thermometers around the world that allow a reconstruction of the global mean temperature. The temperature over this period is virtually the same as the baseline 1850–1900 that was used in the IPCC AR5 report, though explicitly not labeled “pre-industrial”. Hawkins et al (2017) found that 1720–1800 is a reasonable approximation of “pre-industrial” taken literally, closely before the steam engine improvements by James Watt found widespread use. Based on two different methods the difference with 1850–1900 was found to be 0.05–0.2°C. Schurer et al (2017) find a range 0.03–0.19°C relative to the period 1401–1800 using model simulations, and 0.10–0.18°C using only greenhouse gas forcings. Using ‘1861–1880’ for “pre-industrial” therefore decreases the warming up to now by about a tenth of a degree, possibly two tenths.
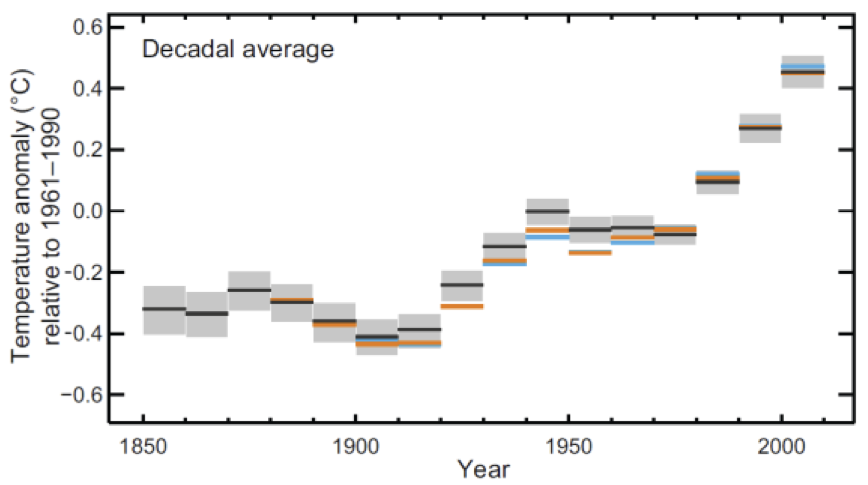
There has been a “Structured Expert Dialogue” between over 70 experts and parties (UNFCCC) in four sessions in the period 2013-2015 that helped clarify points of the IPCC AR5 report in the context of the long-term goal of the Convention. One sentence in the final report states that “On the global average temperature, the IPCC reported an increase of 0.85 °C since 1880, a good approximation for pre-industrial levels (figure 2)”. This is said to define the Paris agreements as relative to the late 19th century, even though for the more ambitious targets the 0.05–0.2 °C difference that was published later may not be a “good approximation”.
Definition of “global”
The Millar et al results are based on the HadCRUT4 estimate of global mean temperature. However, this dataset averages observations over 5º×5º boxes and disregards boxes without observations, assuming implicitly they warm with the global average. In the Arctic, observations are sparse and down-weighted by this method because the boxes are small. HadCRUT4 therefore does not include most of the rapid Arctic warming. Other datasets, such as GISTEMP and indeed a filled-in version of HadCRUT4 by Cowtan & Way attempt to remedy this by effectively giving these sparse observations more weight (or using other data). The difference in warming between HadCRUT4 and the more complete estimate of GISTEMP is 0.2 °C. The Cowtan & Way filled-in dataset based on HadCRUT4 has a 0.1 °C higher warming than HadCRUT4 itself. Including an estimate the Arctic warming (and other regions) therefore results again in one or two tenths of a degree more warming.
Adding this up we get a difference in the observed temperature rise from “pre-industrial” to “now” of the “Global” Mean temperature of about 0.3 °C: Millar et al take 0.9 °C as their starting point, whereas Gavin Schmidt (GISS) claims the world has already warmed about 1.2 °C (systematically, not in individual years). When trying to reach a goal of 1.5 °C, this is a difference between having 0.6 °C to go or about 0.3 °C. This is illustrated by comparing the trend lines in figure 2 of the global warming trend as a function of the CO2 forcing in the HadCRUT4 and GISTEMP datasets. Our numbers above were derived from these linear fits. This extrapolation to pre-industrial was one of the methods used by Hawkins et al (2017), but with total forcings on the X-axis, which gives similar results.
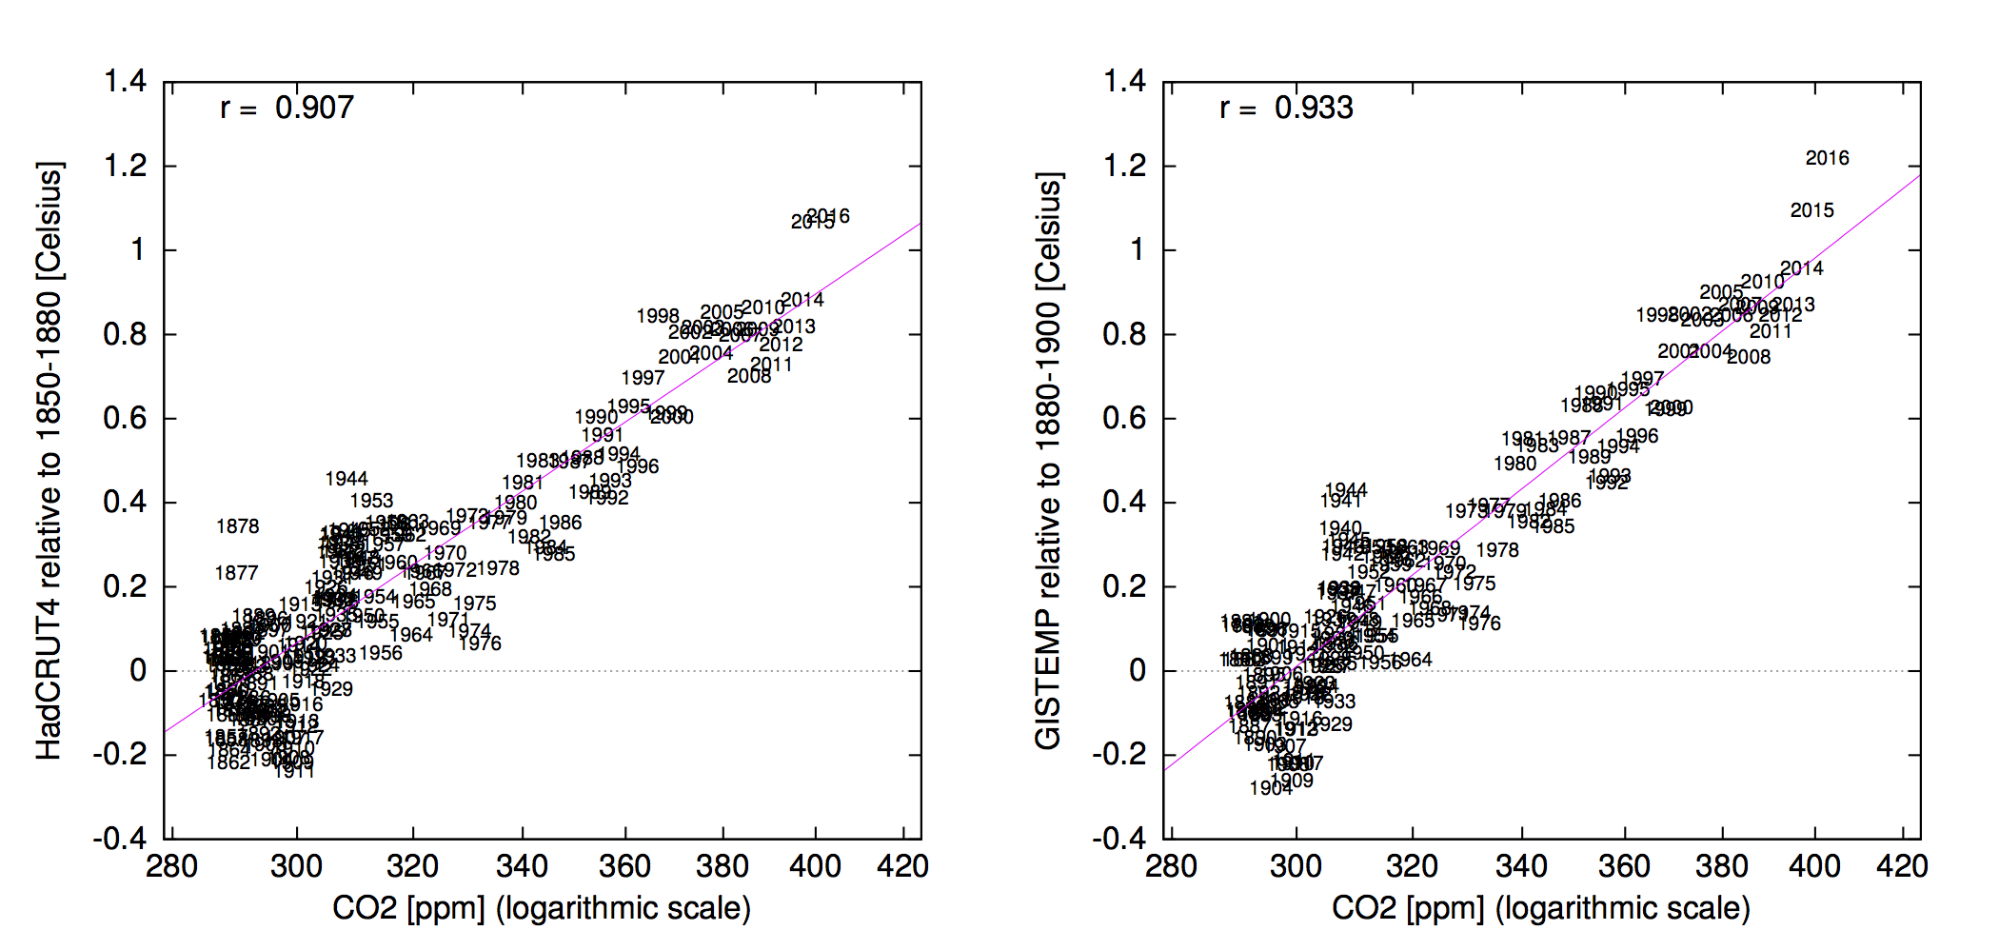
The Structured Expert Dialogue is a bit confusing on this point. The text refers to the linear fit in Chapter 2: a linear trend of 0.85 (0.65 to 1.06) °C, over the period 1880–2012. This linear trend is not shown in the figure, but is reproduced below in figure 3. It is shown that using a fit scaled with the logarithm of the CO2-concentration (forcing) results in a much more realistic estimate of the global warming up to now. The linear fit also systematically underestimates the trend with larger discrepancies at the end of the period than in the late 19th century. It is a very bad approximation of the warming up to now, which is acknowledged in later IPCC chapters.

This linear trend, based on the average of the HadCRUT4, NOAA and GISTEMP datasets, seems to have been reinterpreted as the difference between the late 19th century and the period 2010–2015 in the dataset with the lowest trend, which happens to give the same numerical value. This exchanges the bias due to the linear trend with a bias due to the missing Arctic, plus the center of the decadal period being in the past. Millar et al correct for the latter but not for the former.
The definitions of “pre-industrial” and “global” (or assuming a linear trend in time) explain the difference between the 0.9 °C warming up to now that Millar et al and others take as starting point and the 1.1 to 1.2 °C that are reported elsewhere using different methods and reference periods.
Cancellations
The definitions above fix the starting point for the 1.5 degree target. Whichever definition is adopted, tenths of degrees warming are vitally important. This brings into play several non-CO2 causes of warming for which very different results are being reported.
Ocean commitment
The ocean absorbs the great majority of the extra heat that is trapped by greenhouse gases. However, it takes a very long time for this heat to mix throughout the ocean, so it is out of equilibrium with the current radiative forcing. The IPCC AR5 report estimates that this amounts to an extra 0.2 to 0.6 °C of warming after stabilizing the composition of the atmosphere, hence inferring a constant radiative forcing. In the case that emissions of greenhouse gases cease, CO2 concentrations will also start to drop because the ocean and biosphere continue to adjust to the higher concentrations. In the models considered in the IPCC AR5 and Millar et al these two effects cancel, leading to no long-term increase in temperature. The uncertainty on this cancellation is quite large as the physical mechanisms of uptake of heat and CO2 in the oceans and biosphere are very different (Mauritsen and Pincus, 2017).
Aerosol commitment
Air pollution with aerosols cools many regions now, most notably in south and east Asia. Reductions in fossil fuel use will not only lead to better air quality, which is highly desirable, but also give extra heating. This was observed in the 1980s in Europe in spring and summer: when SO2 emissions were reduced to combat acid rain the temperatures increased much faster than global warming (see e.g., van Oldenborgh et al, 2009). We estimate from the IPCC aerosol forcings (WG1 AR5 Chapter 8, Table 8.4) that the global effect is 0.1 to 0.3 °C heating due to the reduction of aerosols from fossil fuel use. Note that the uncertainty in aerosol forcing is large and asymmetric, with a long tail towards more cooling now and hence more warming when air quality improves.

Methane reductions
On the other side of the balance, methane has caused a sizeable fraction of the warming trend up to now (see, e.g., IPCC WG1 AR5 SPM Figure 5). Approximately a quarter of these emissions are associated with extraction and transport of fossil fuels (natural gas is largely methane). The rest is mainly emitted by cattle, rice paddies and landfill. A reduction of fossil fuel use will reduce the first component. In some scenarios, such as the RCP2.6 scenario shifted by 7 years used by Millar et al, this reduction is steep and offsets the heating due the reduction in anthropogenic aerosols. Again, due to the uncertain strength of the aerosol forcings the uncertainties on this cancellation are large, especially in the positive direction. Mauritsen and Pincus estimate that there is a sizeable chance (about 15%) that the 1.5 °C target will inevitably be exceeded, even with the definition of only 0.9 °C warming up to now.

To summarise, the extra warming after all CO2 emissions cease could be close to zero. The two well-known positive contributions (ocean heating and aerosol reductions) are compensated by CO2 uptake and rapid methane reductions to first approximations, as already reported in the AR5 Chapter 12. However, the uncertainties on these cancellations are very large and taken together enhance the chances that the 1.5 °C target is out of reach already, depending mainly on the strength of the present-day aerosol cooling.
Conclusions
Reaching the 1.5 degree target agreed-upon in Paris as a desirable goal is going to be hard. Exactly how hard depends on a couple of crucial definitions and physical effects of the order of a tenth of a degree. Millar et al. have reduced these uncertainties by moving the starting point of modelling from pre-industrial to the present, taking the observed trend as given (and attributable to human influences, a point we have not discussed). However, they also use definitions of the global mean temperature rise that are not universally accepted and estimates of committed warming for zero emissions that are at odds with older (AR4) ideas that were based on constant atmospheric composition. To aid in the understanding of the results of Millar et al., we tried to highlight differences in definitions and cancellations in temperature trends after CO2 emissions would have ceased. Whatever the final way the 1.5 degree or indeed 2 degree target is defined, it will take a huge effort to reduce greenhouse gas emissions fast enough to reach it.
8.3.4.3 Aerosol–Cloud Interactions
The total aerosol ERF, namely ERF due
to aerosol–radiation and aerosol–cloud interactions (excluding BC on
snow and ice) provided in Chapter 7 is estimated with a 5 to 95%
uncertainty between –1.9 and –0.1 W m–2 with a best estimate value
of –0.9 W m–2 (medium confidence).
You estimate the total aerosol warming impact of 0.35 W/m^2 to be between .1 and .3 C. But you neglect the -0.55 W/m^2 impact from aerosol cloud interactions. By your estimate of warming this would produce an additional 0.3 to 0.9C of warming not included in your calculation.
I also note that 2XCO2 RF of +2.3 W/m^2 is used to produce a value of equilibrium climate sensitivity, using your range of +.1 to +.3C of warming for the IPCC table 8.4 aerosol forcing value of .35W/m^2 would produce an ECS range of 0.66 to 1.97 which is far below the IPCC range of values. Using the IPCC range estimate of 1.5-4.5C and applied to the aerosol forcing value in table 8.4 would produce a warming impact from aerosol removal of +0.25 to +0.68 of warming and if aerosol cloud interaction is included would produce a final aerosol warming range of +0.6 to 1.75
Jai, what is the source for your estimation of -0.55W/m² forcing due to “cloud-aerosol interaction” ? Did you consider the latest research about this interaction? See https://www.nature.com/nature/journal/v546/n7659/full/nature22974.html and https://www.nature.com/nature/journal/v546/n7659/full/546483a.html .
I used the AR5 for the 0,55 forcing however, more recent work from Rosenfeld using satellite data shows quite conclusively that this value as been underestimated significantly with the final value closer to 1.0 W/m^2
see: https://forum.arctic-sea-ice.net/index.php/topic,1384.msg187032/topicseen.html#msg187032
I note also that our CMIP6 preliminary results and the emerging constraints are all pointing to ECS of closer to 4.5C not the 2.89C used in the simple FAIR model that (by the way) severely underestimates carbon cycle feedbacks, does not include aerosol impacts on arctic sea ice, albedo increases under rapid sea ice loss and regional warming due to that loss of sea ice of close to 8C above norm for the months of Sept – Dec
Well, no. There isn’t no way anymore to cool the oceans fast enough to prevent enhanced ghg production from permafrost. The natural systems of warming the planet have been jump started by human activity and there’s no stopping before EAIS is the only significant body on earth. If you need additional proof the image linked might provide it. thehttp://www.mypokecard.com/en/Gallery/my/galery/8X4NVRFcVWKo.jpg