Record extreme temperature events are increasing in frequency as the climate warms. Several of these records have been surprising, in that they have been far above the previous record event for that location. Longer and earlier records, often possible through data recovery from undigitised archive material, would help quantify the risks of such record extreme temperature events.
As an example, the figure below shows average June temperatures in the city of Durham in the UK from 1850-2020, which is the time period typically available from global gridded datasets of temperature. There has been a small warming during this month at this location of around 0.7°C.
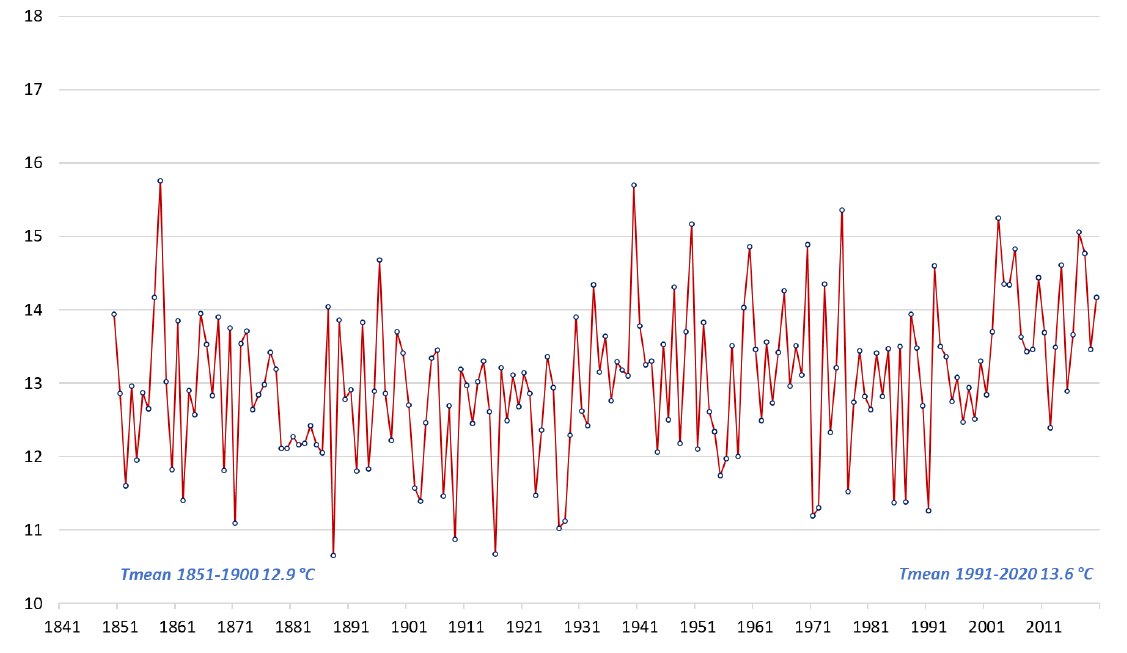
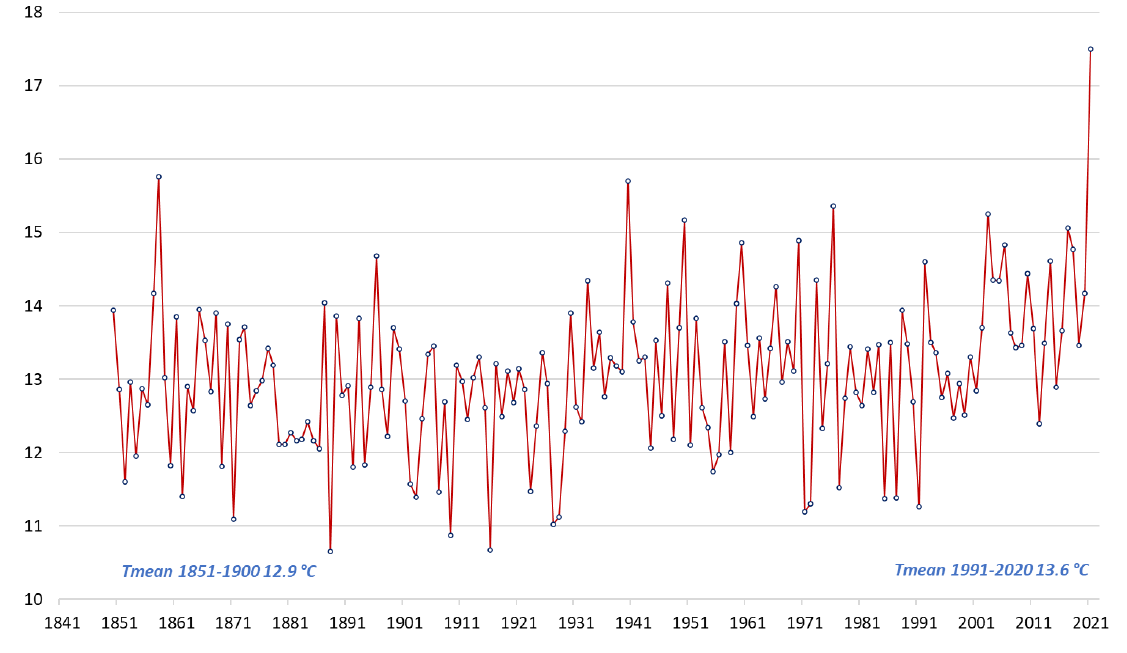
Now imagine a very warm June in 2021 which breaks the previous record by over 1.5°C. This may appear to be a surprise based on the earlier data. It would be a noteworthy event, but consistent with our understanding of how a warmer climate increases the likelihood of such events occurring.
HOWEVER…
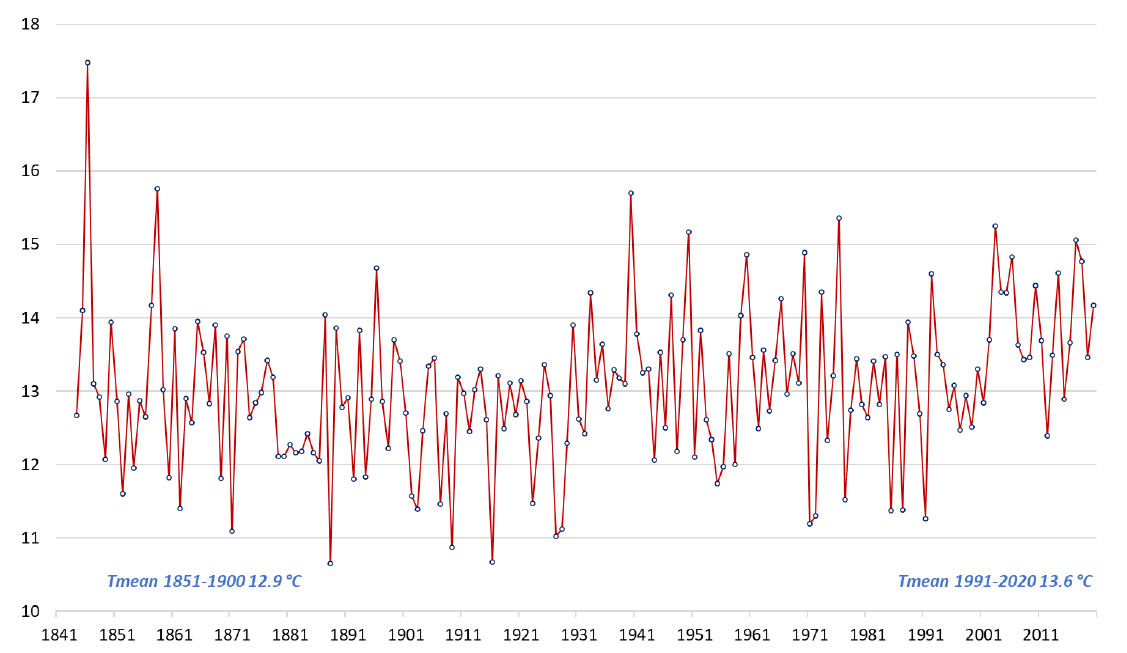
The temperature imagined for June 2021 in the previous figure has already occurred. The figure below shows the full time series available for June in Durham, thanks to data rescue efforts by Stephen Burt.
The record warm June actually happened in 1846.
This should not be surprising.
Most of the warmer months observed at any location have occurred more recently, but the weather is variable meaning that the record warmest events are sometimes still a long way in the past.
This example also highlights the value of producing longer records, which is possible for many locations by digging through paper records in archives and libraries.
Perhaps we are due a new record June temperature in Durham?
One common problem with these old extremes is that they may have been recorded using different equipment that is more sensitive t to hot extremes, eg a thermometer on a north wall that gets into the sun after 6pm local solar time. Including those data into your extremes analysis requires checking the metadata and preferably an overlap series if the observational methods have changed. Or wait for the homogenisation guys to do the hard work.
Agree we need to be careful. June 1846 is also the warmest in Central England and Durham is not part of that series. The team doing the data recovery have gone back to the original logbooks to get the metadata too. I should check 20CRv3 though as well. Thanks, Ed.
June 1846 also looks to be the warmest June in 20CRv3 for the northern UK as well.