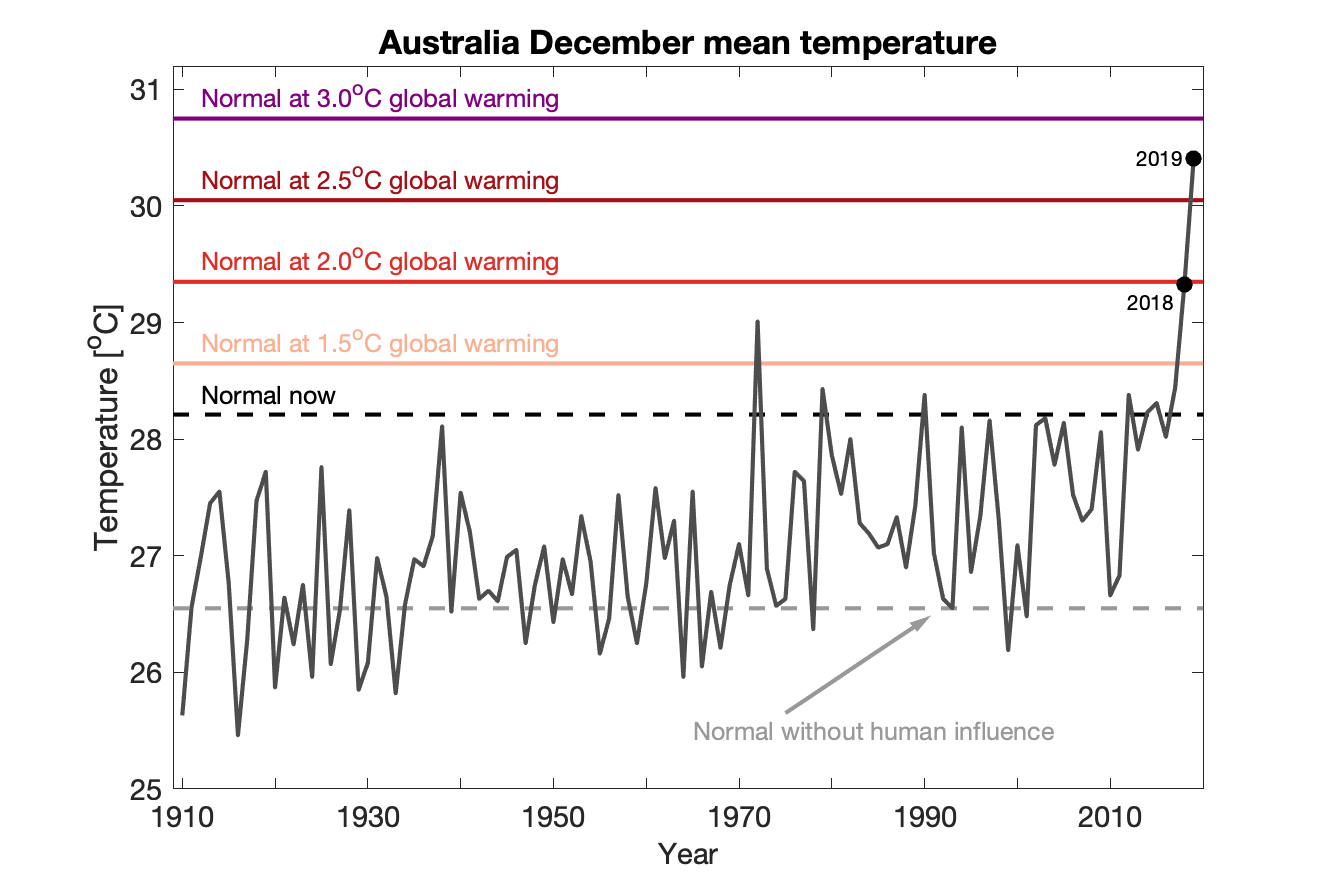
In December 2019, the average temperature across Australia was about 2°C above what would be expected for the present-day, which is another 1.5°C above temperatures that were normal for December before humans started warming the climate. These extreme temperatures have contributed to the catastrophic bushfires which have devastated large areas.
But what may be considered ‘normal’ is constantly changing.
In a world which has warmed by 3°C – roughly the current global trajectory – what was extreme will be entirely normal.
The extreme temperatures experienced in Australia are therefore a glimpse of the future. Similar unusual weather patterns to those experienced in December in that future world would cause extreme temperatures that are unimaginable now.
This graphic uses observations of average December temperature for Australia and regresses this against a smoothed global annual average temperature. Land areas warm faster than ocean areas, and so it is found that December temperatures in Australia are warming 1.4x faster than the global annual average. Assuming the same relationship holds in future allows the estimates of what Australian temperatures will be normal for different levels of total global warming.
There have been innumerable posts about the effects of the World’s rising temperatures, can anyone direct me to where there are similar posts or articles about how this situation could be reversed. Farming , has been blamed for a good percentage of the causes by the release of carbon dioxide and other gases and a possible cure could be to go back to farming without he use of chemicals so that crops are produced on living soils which are abundant in organisms and organic matter which will, apart from other benefits, retain water.
This is exactly what I am looking for – solutions and how to do on a small and big scale. I am working on a regional rural project in the planning stage in Austria. Would you like to forward what you have found so far and exchange results? Cheers
Hi Ed, Thanks for posting this information on how the graph is constructed so that it can be replicated for other areas. One question, how is the line for normal now, defined in your graph?
Last decade or some other time frame.
Thanks
Rick Highsmith
At this stage, extremes are already severely disrupting planetary life support systems. Such as food chains, reefs, and forests that will never return as a recognizable past. Why should they? The climate will have changed and will continue to do so as tipping points that have already started, Perma Frost Methane release and others run their course. Higher life forms then become impossible Perhaps not his year or the nex but iw will be written in stone very soon.
Hi Leif, I am planning a project in Lower Austria to counter several negative factors and to prepare for impacts. I agree to what you say. Would you be so kind to communicate figures and evidence I could use to substantiate these claims? As you know, the official scenarios exclude all sorts of tipping points. Where would I find such data? Thanks for your imput.