John Tyndall (c.1822–1893), Irish physicist, mountaineer, and public intellectual, is best known for his work on the absorption of heat by gases such as water vapour and carbon dioxide in the atmosphere (and for explaining why the sky is blue). Seen in retrospect, he is a critical figure in the history of climate science. Yet this retrospective view hides a complex, and in many ways more interesting story. 
In The Ascent of John Tyndall, the first major biography of Tyndall for more than 70 years, I unpick the motivations behind Tyndall’s work on the absorption of heat by gases, which started in 1859, and the manner in which he interpreted them.
Guest post by Roland Jackson Continue reading John Tyndall: founder of climate science? →

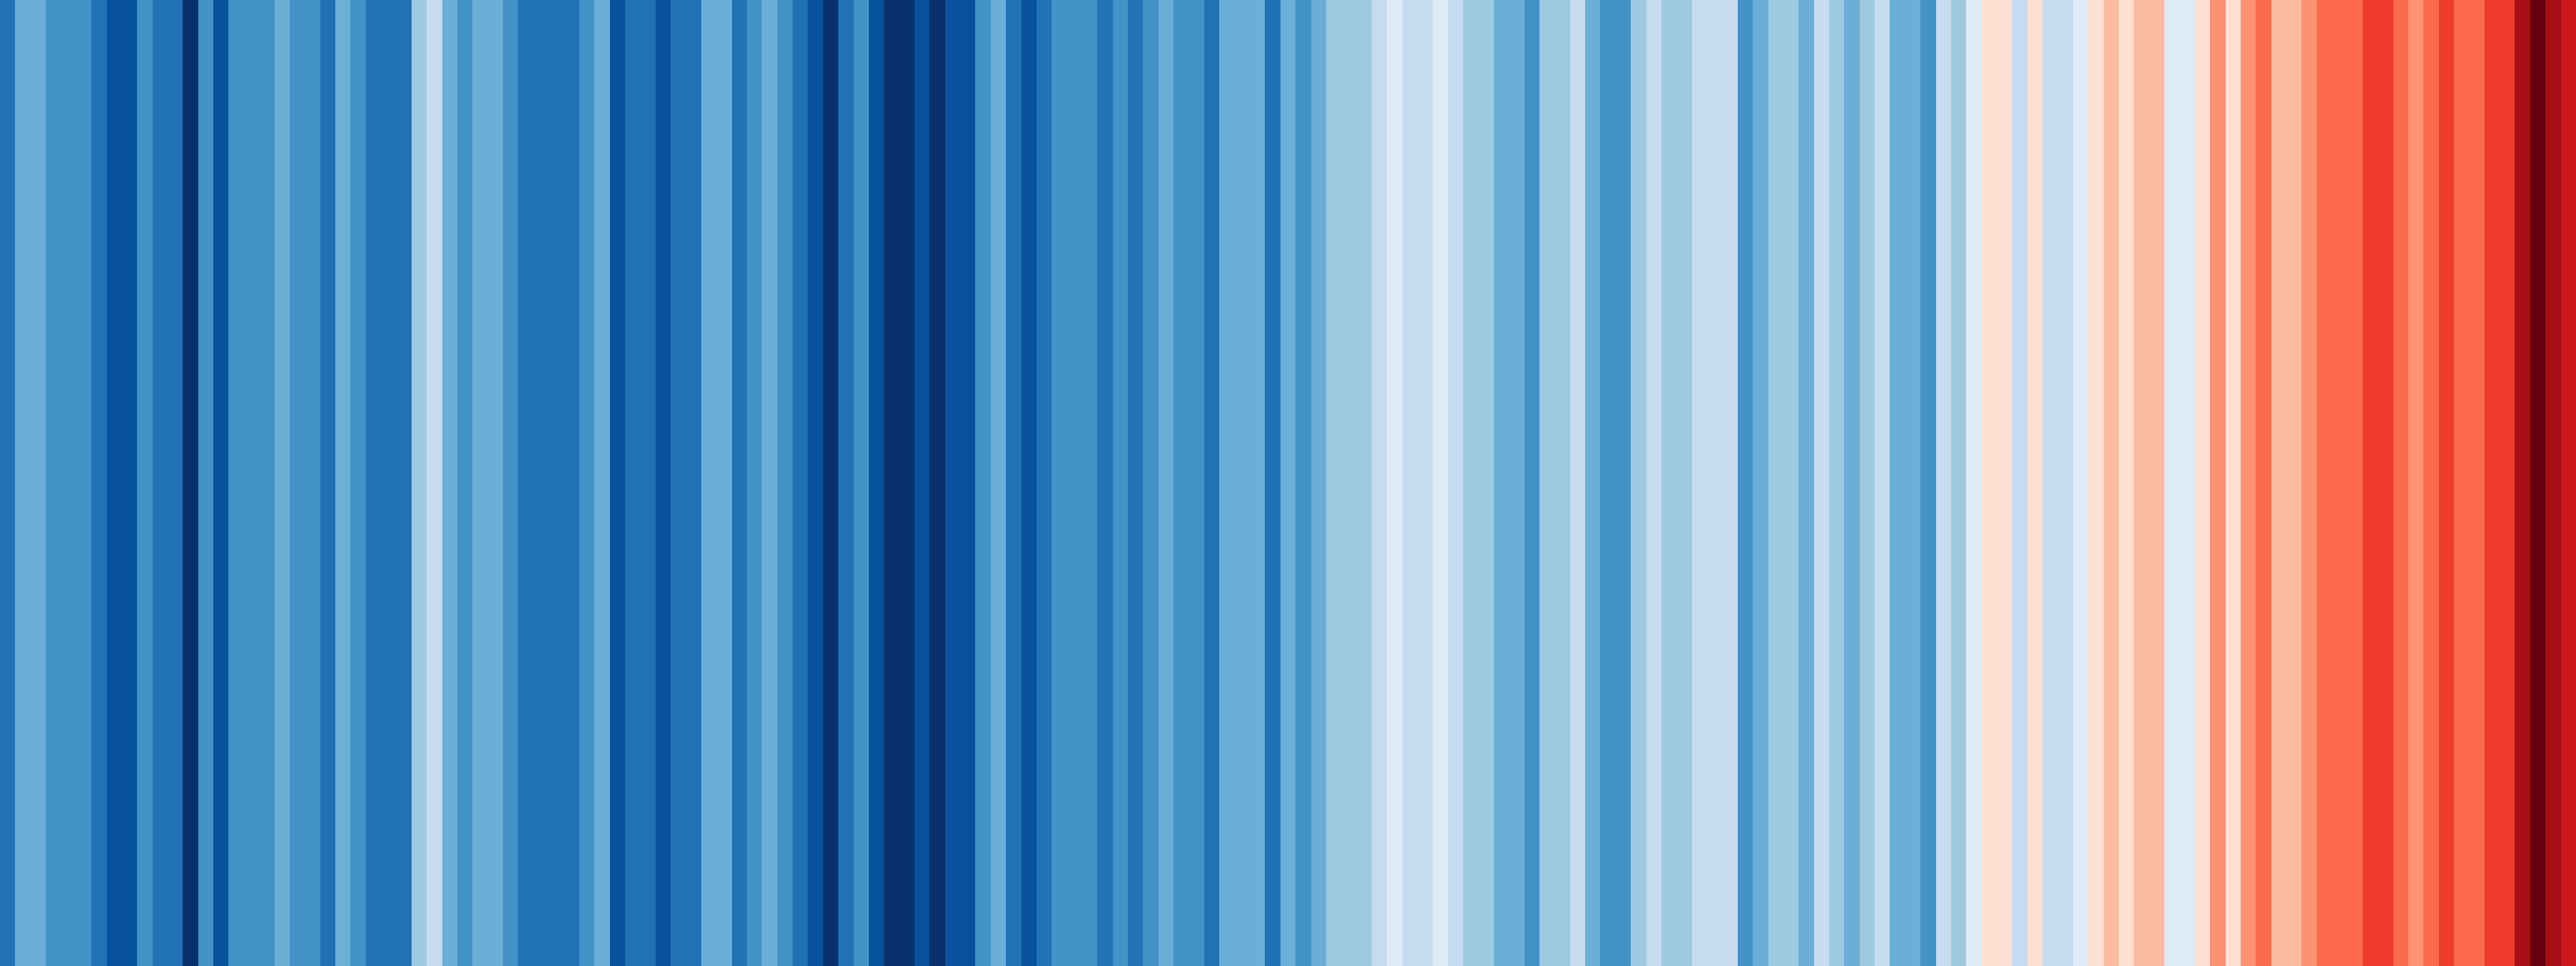
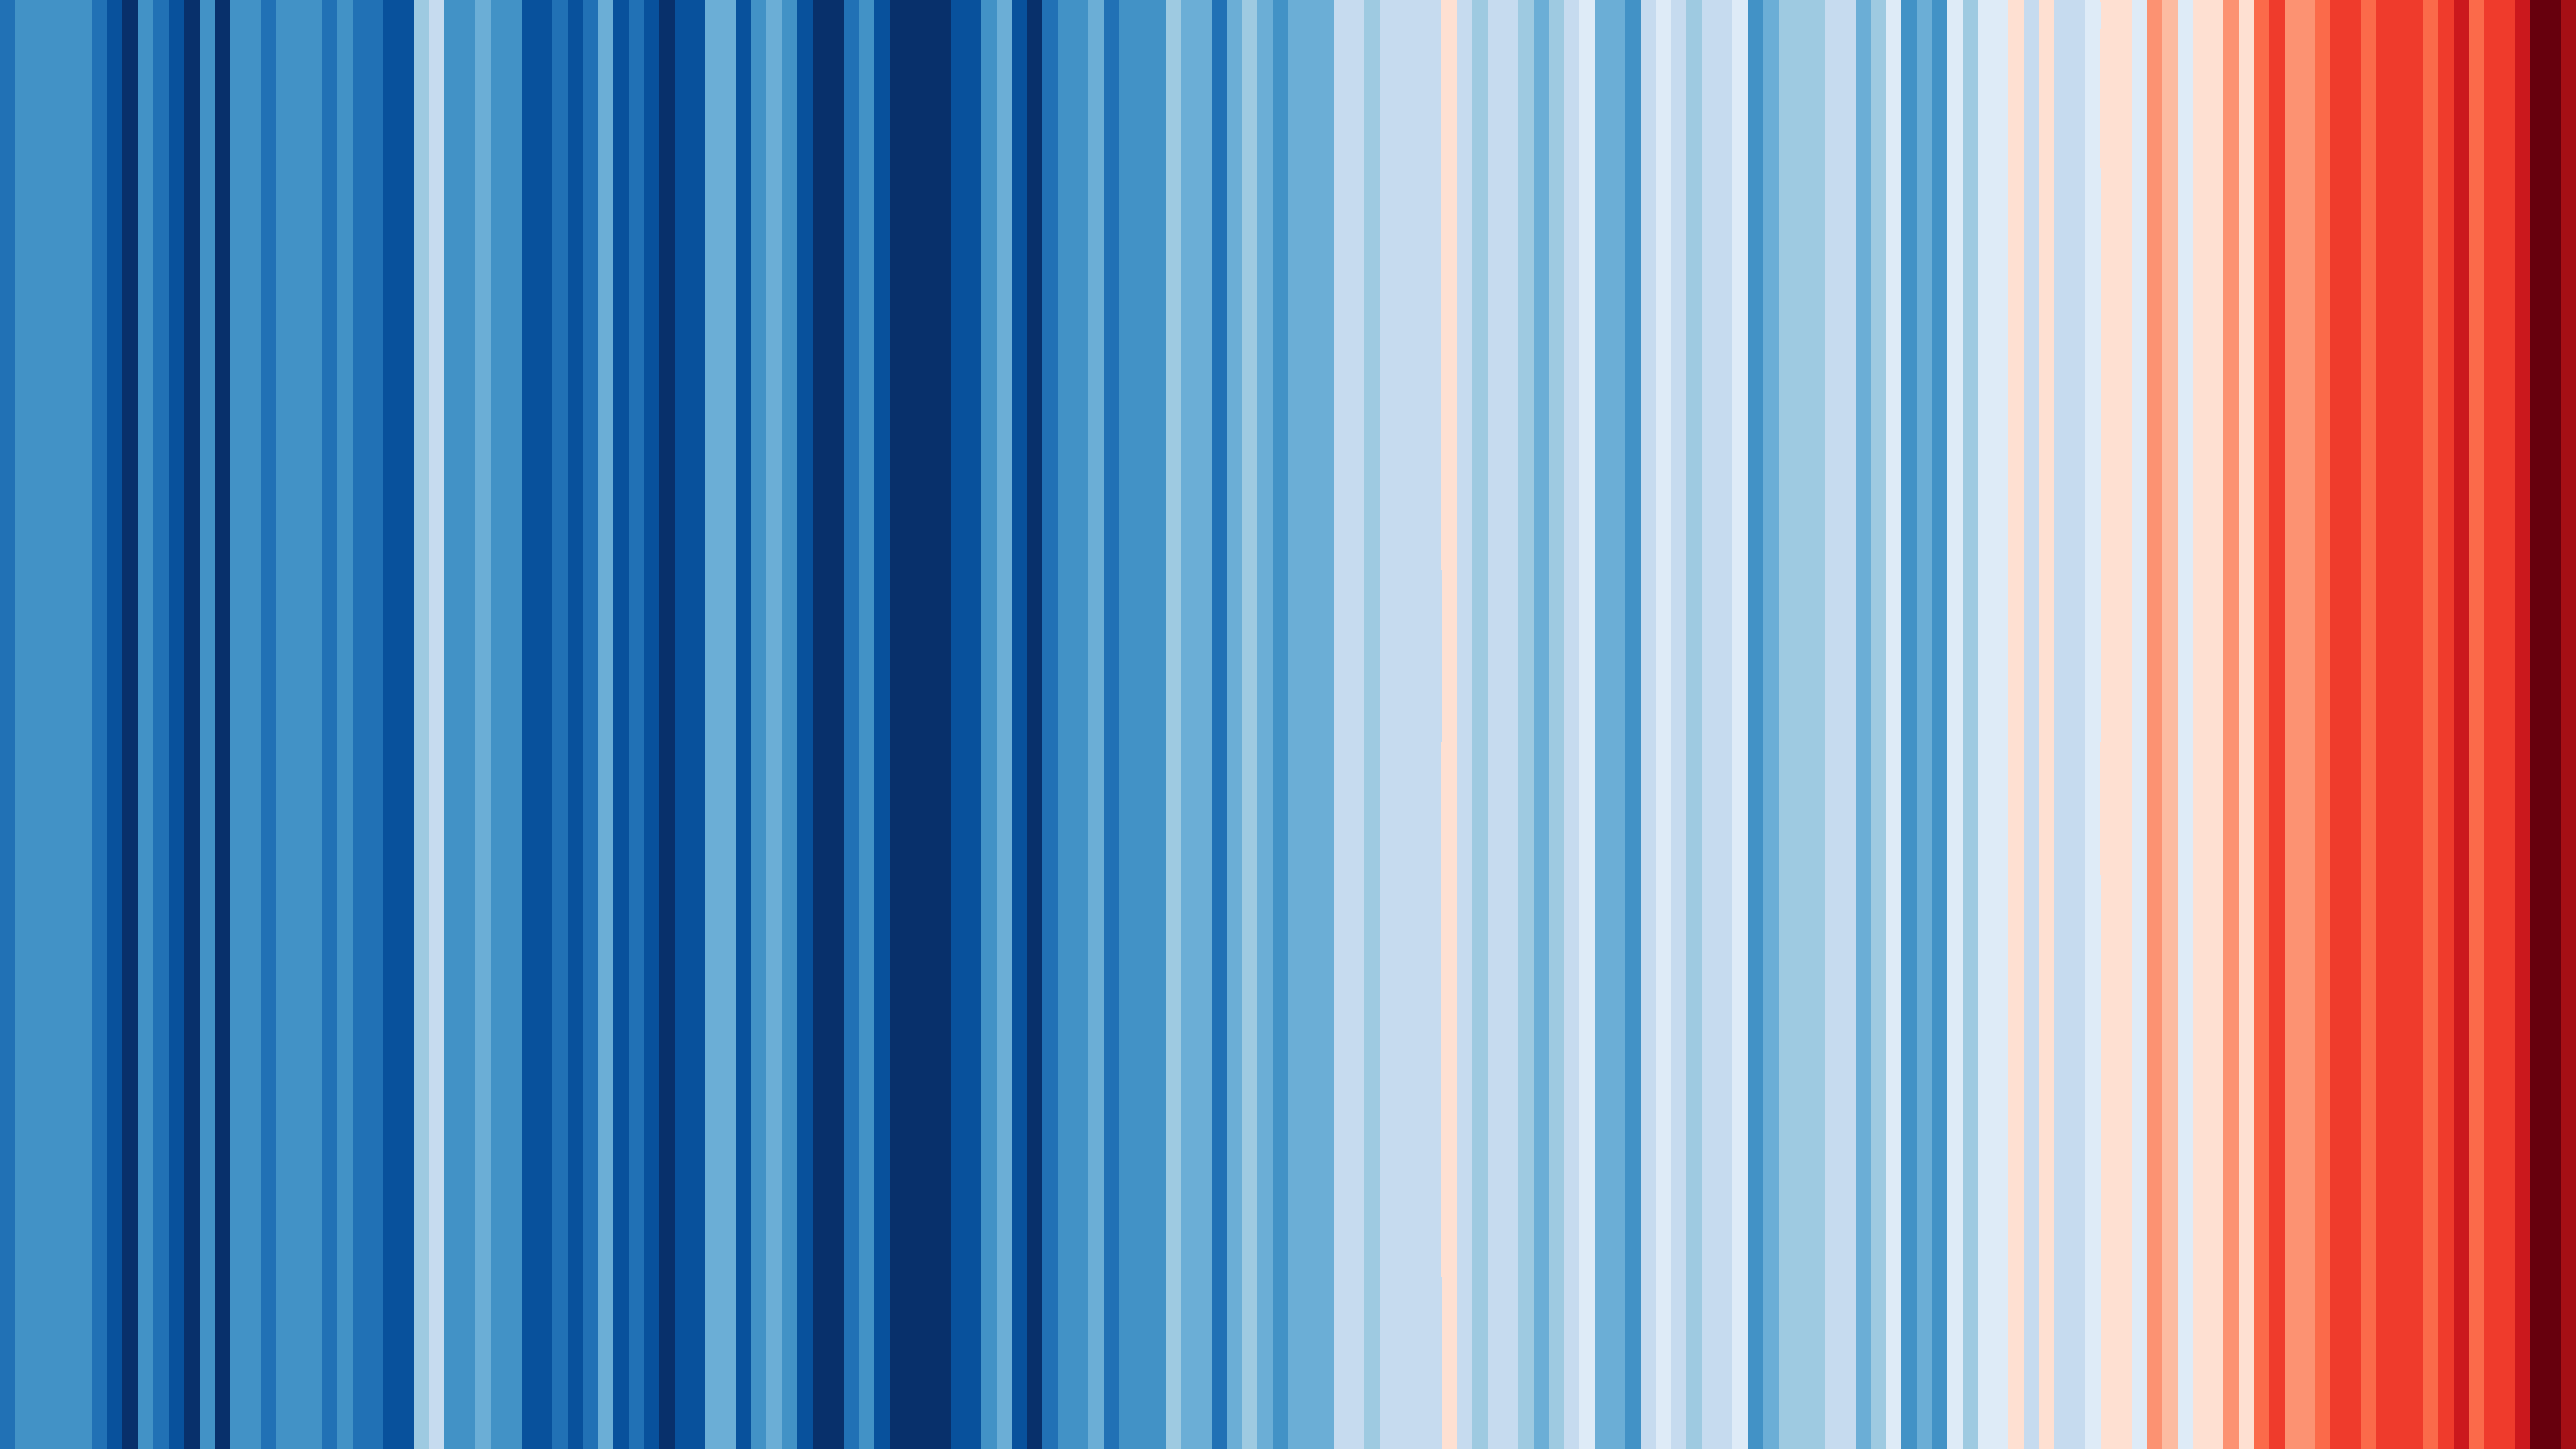
 Climate change is a complex global issue, requiring simple communication about its effects at the local scale. This set of visualisations highlight how we have witnessed temperatures change across the globe over the past century or more. The colour of each stripe represents the temperature of a single year, ordered from the earliest available data at each location to now. All other superfluous information is removed so that the changes in temperature are seen simply and undeniably.

