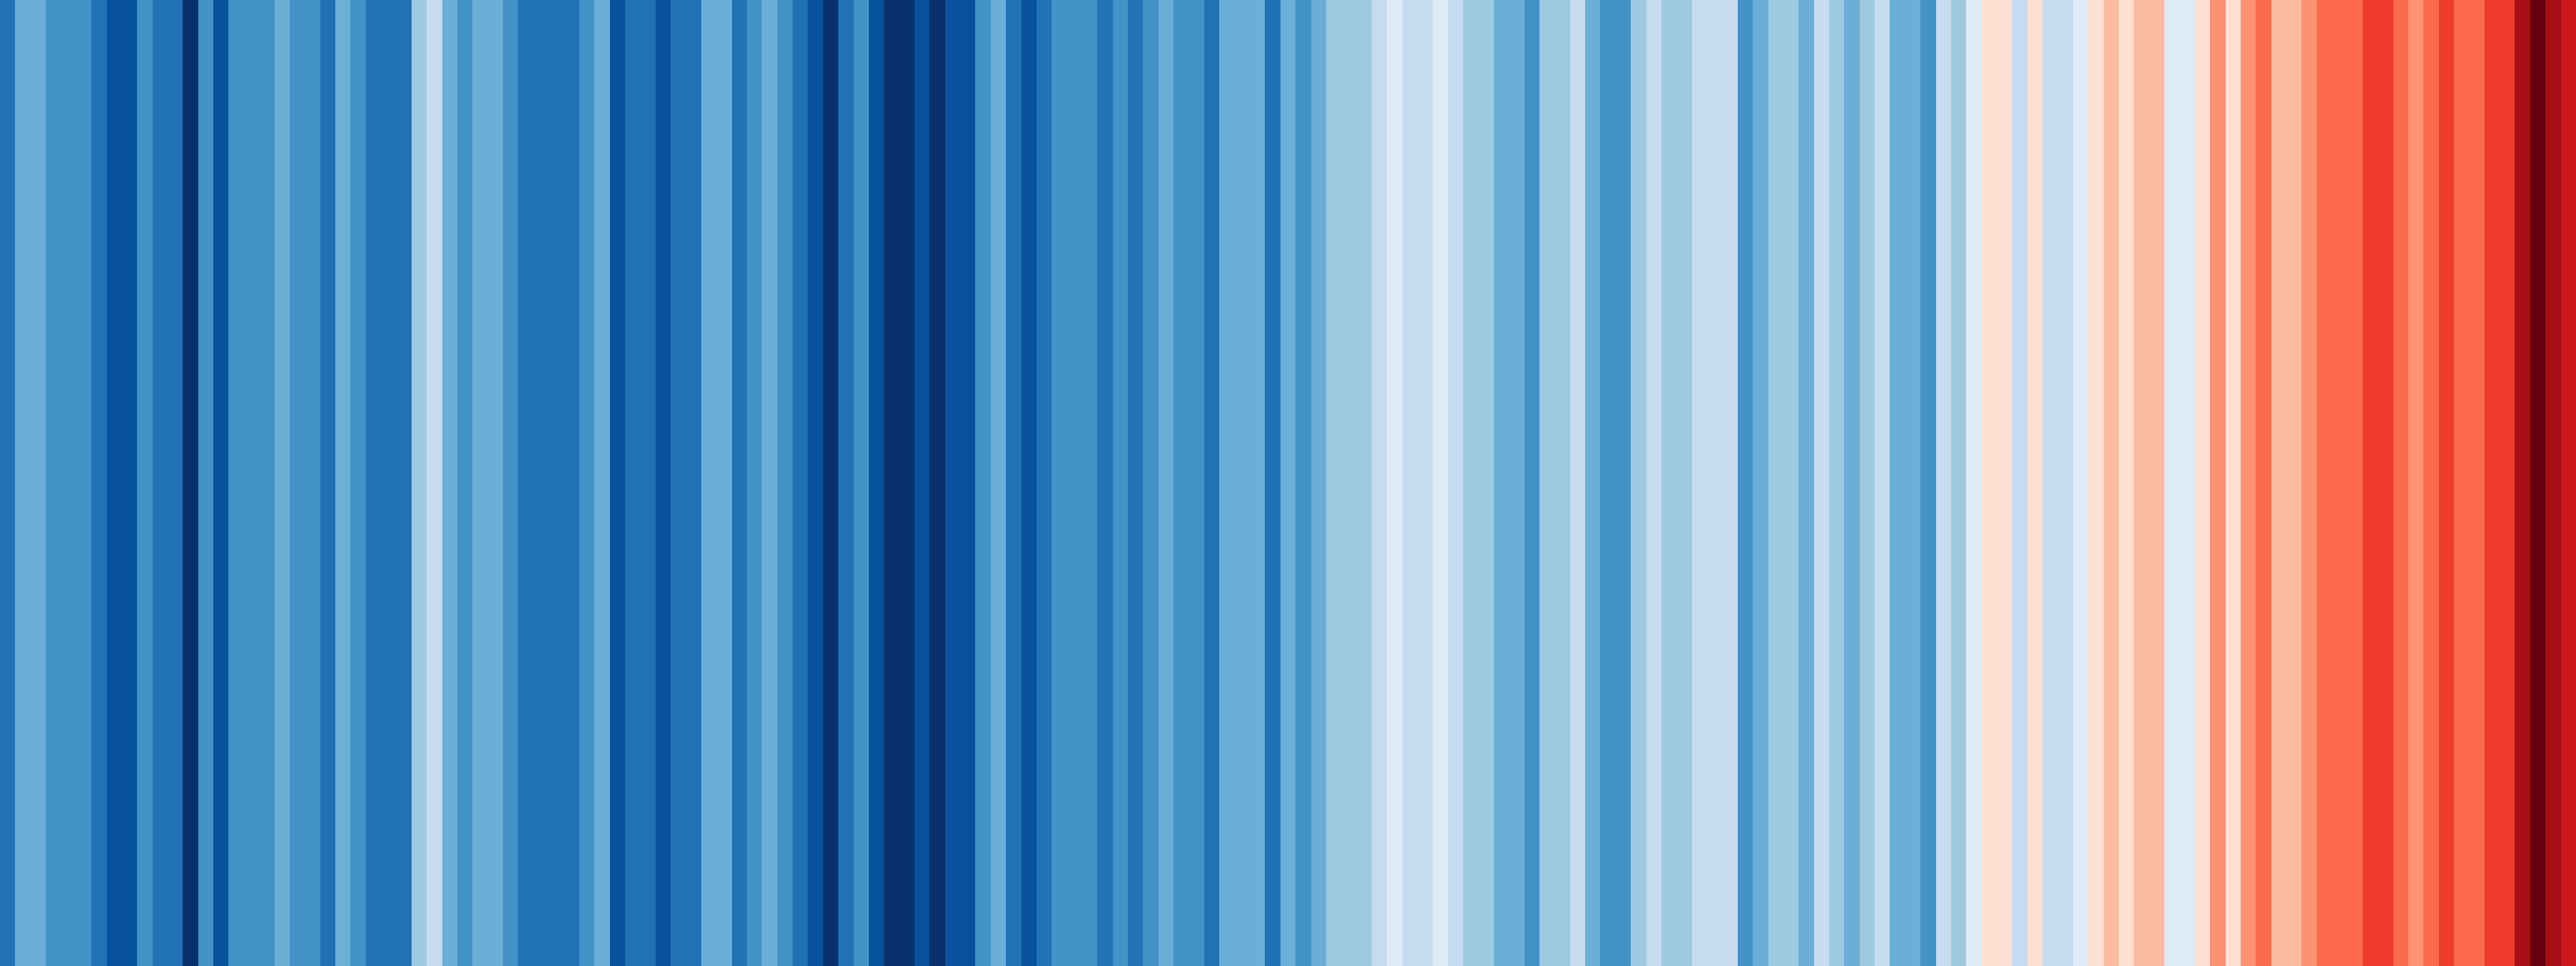
With 2018 coming towards an end, the World Meteorological Organisation (WMO) released their provisional State of the Climate report. The WMO asked whether Climate Lab Book could provide some updated graphics, also reproduced here.

Warming stripes for 1850-2018 using the WMO annual global temperature dataset.

Climate spiral for the WMO global temperature dataset.

Arctic sea ice concentration from NSIDC for Septembers during 1979-2018.
Hi
Thank you for sharing!
Which tool can plot the Circle Graph? I want to plot a Circle Graph for my data but I don’t know a tool for plotting it so I decided to develop a new tool to plot the Circle Graph. If you have any information about it please share it
Thanks.
ps – another Q – correct citation for 1850-2018 warming stripes?
Climate Lab Book webpage + reference to Morice et al. 2012?
Morice et al is from 2012, plus don’t show the warmig stripes?
Morice, C. P., Kennedy, J. J., Rayner, N. A., and Jones, P. D. (2012). Quantifying uncertainties in global and regional temperature change using an ensemble of observational estimates: The HadCRUT4 data set. Journal of Geophysical Research: Atmospheres, 117(D8).
Hi Ed – Great graphics for a critically important subject. Thanks for the obvious work that has gone into them… Nothing more difficult that making complex data look clear and simple, which you have achieved nicely here ! Will definitely refer to them in my future social & sustainable responsibility uni lectures I give here in southern France.
Next summer, we are organizing a big “Yarn Bombing” exhibition in my swiss mountain village (*) which will attract many visitors: many people and groups will decorate the village with crochet and knitting.
I would like to crochet the Warming Stripes for GLOBE, in a large format, but for that I would need the number of colors used and especially the relationship between them, between the colors of the different bands, not to do anything wrong.
Can you tell me where I find those numbers?
I know that my request must seem very curious, or ridiculous, but any support and any method are good to raise public awareness!
THANKS A LOT, best wishes.