A change in global surface temperature to 2°C above pre-industrial climate is often used as a threshold for ‘dangerous climate change’. Although impacts will tend to get worse as temperatures increase, there is no clear evidence yet of such a sharp threshold in the climate. However, the 2°C threshold seems to be useful to policymakers. So, when might we expect to reach this threshold and have any regions experienced such a change already?
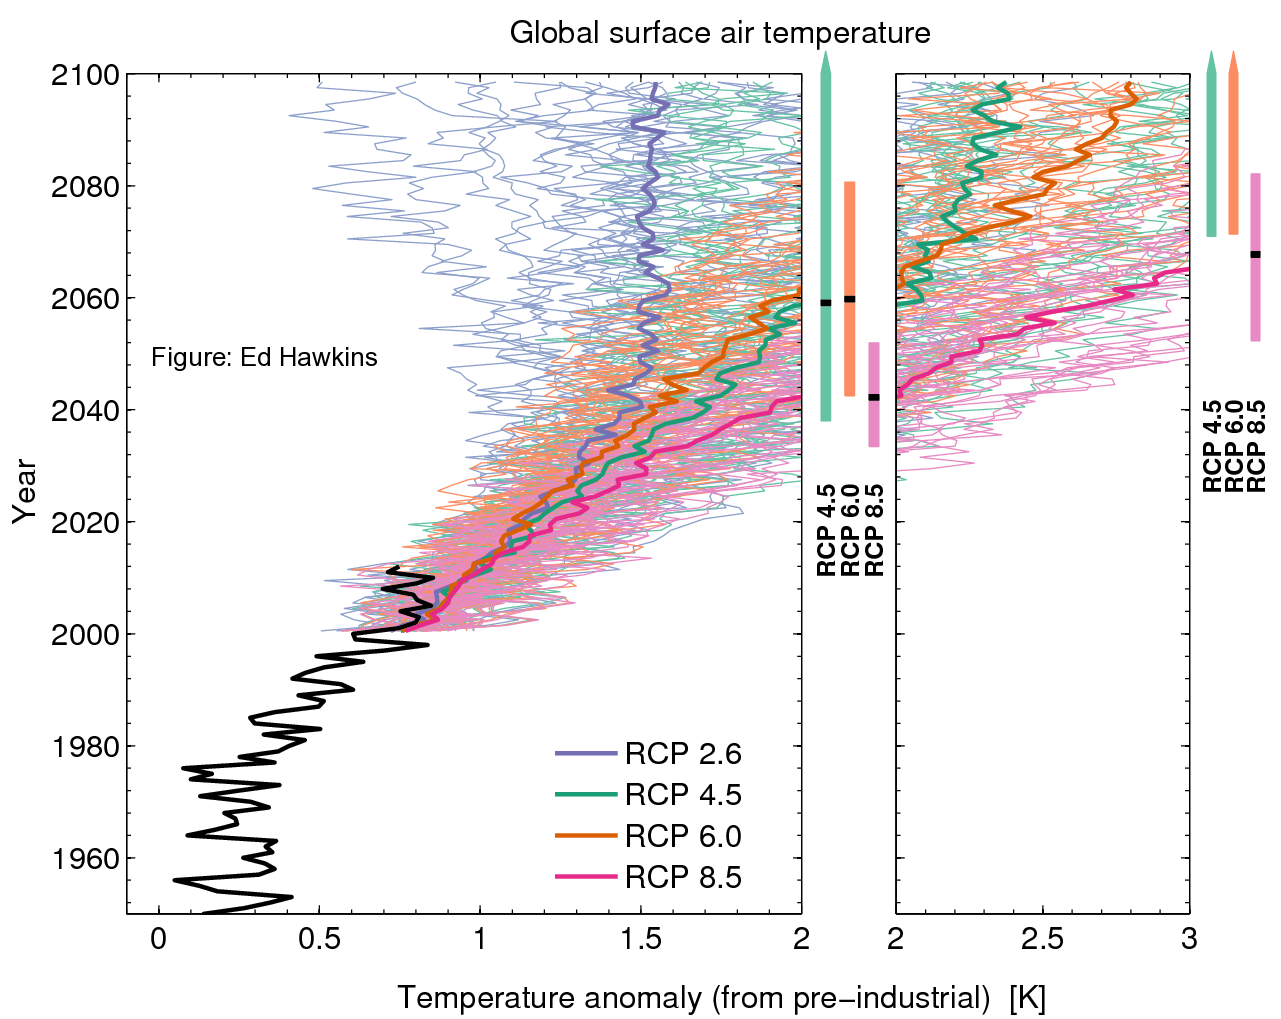
The first figure shows the CMIP5 projections for global mean temperature, expressed relative to ‘pre-industrial’ (defined here as 1850-1900), but with the axes swapped from their usual orientation. This allows a visualisation of the uncertainty in when this threshold will be reached for each emissions scenario (RCPs). For the highest emissions future (RCP8.5), the 2°C threshold is projected to be crossed between around 2035 and 2055. Lower emissions can delay this crossing until 2060 or later.
This figure follows the CMIP3 version published by Joshi et al. (2011), and discussed previously. Personally, I think it is a shame that the IPCC AR5 did not produce such a figure in the WG1 report. However, the IPCC did consider an assessment of threshold crossing in the Summary for Policymakers:
[By the end of the 21st century] warming is likely to exceed 2°C for RCP6.0 and RCP8.5 (high confidence), more likely than not to exceed 2°C for RCP4.5 (high confidence), but unlikely to exceed 2°C for RCP2.6 (medium confidence).
In addition, a 2°C global temperature change is projected to result in robust changes in the water cycle for many regions, higher than average warming for Europe, and the disappearance of summer Arctic sea-ice.
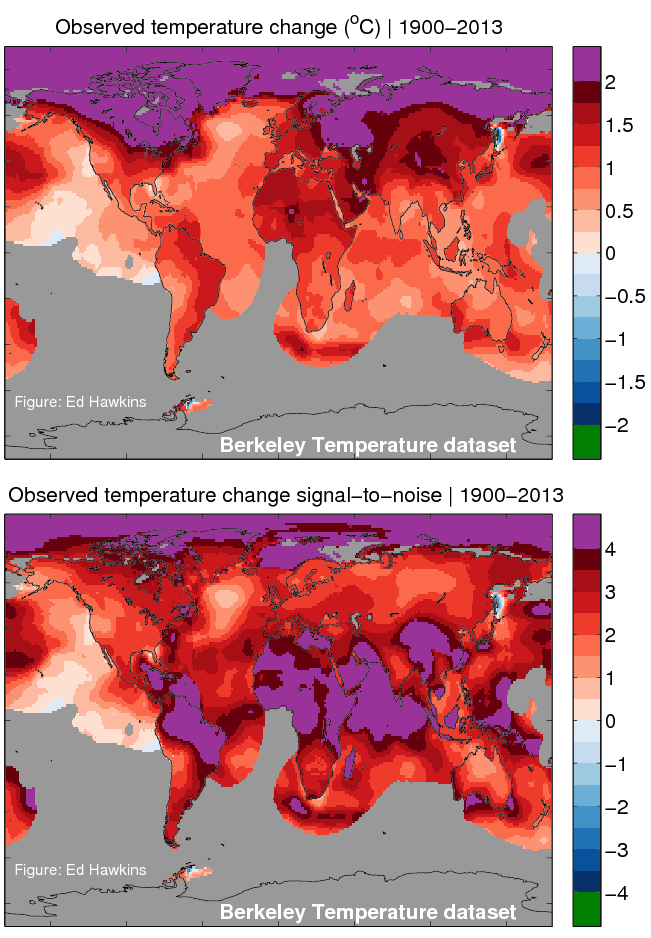
Although the 2°C threshold is a global one, we next consider observed regional temperature changes. The figure below shows the observed temperature change between 1900 and 2013 using the Berkeley Earth Temperature (BEST) dataset (see footnote 2), with purple regions indicating where the 2°C threshold has already been crossed locally. Note that the Arctic and land regions show the largest warming, meaning a 2°C threshold globally means a larger change over most land regions.
The second panel shows temperature change expressed relative to the amplitude of local temperature variability (signal-to-noise), i.e. it is the observed temperature change divided by the inter-annual standard deviation of temperatures. This shows a different picture: although the tropics have experienced smaller absolute warming than the extra-tropics, it is a much larger change relative to the background variability which they are used to. In places, the change is more than 4x the levels of variability, suggesting that the tropical regions will experience some effects of climate change the earliest.
UPDATE (16/04/14): The Better Figures blog discusses the map projection used in the figures below. Alternative Mollweide projection versions of the temperature change and signal-to-noise maps are available.
1Interestingly, it seems as though one of the early policy thresholds proposed was a rate of change: 0.1°C/decade. IPCC AR5 WG2 also examined this in their Technical Summary.
2Methods: a fourth order polynomial is fitted over the entire continuous record of annual means at each grid point. The difference in the value of the fitted polynomial between 2013 and 1900 is shown. The variability is defined as the standard deviation of the residuals from this smooth fit at each grid point. Grey regions show where data is not continuous from 1900-2013.
Is there any chance of pushing the x axis out to 4C? Just to see if/when RCP8.6 might hit that temperature.
Hi.
An advice from a skeptic: Work hard to think that we actually do not have temperature data from 1950-2010 without greenhouse gases.
So the question is whether global temperature rises to a certain extent due to greenhouse gases or natural variation? And the answer to that question is as of now just assumptions.
Cheers
Jonny O
Hello Jonny O,
Yes we don’t know 100% what earths temperature would have been if the level of green house gases present in those 60 years was significantly less, but we can scientifically judge within a very high confidence. One could linguistically argue the answers to be assumptions, but in practice an assumption and a scientific theory are very far from analogous.
I appreciated the improved projection:
http://betterfigures.org/2014/04/16/projection-distortion/