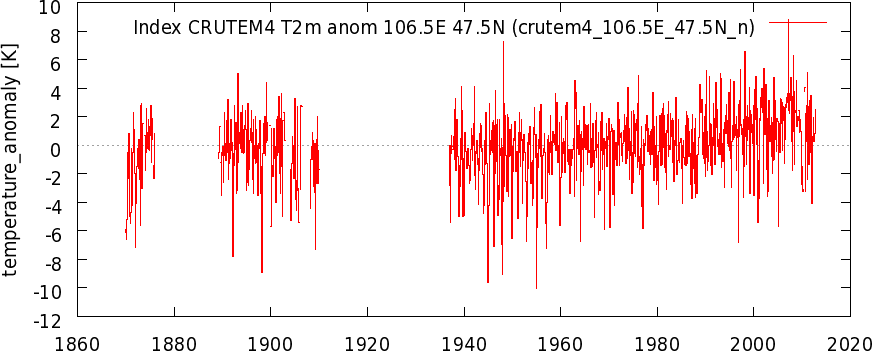
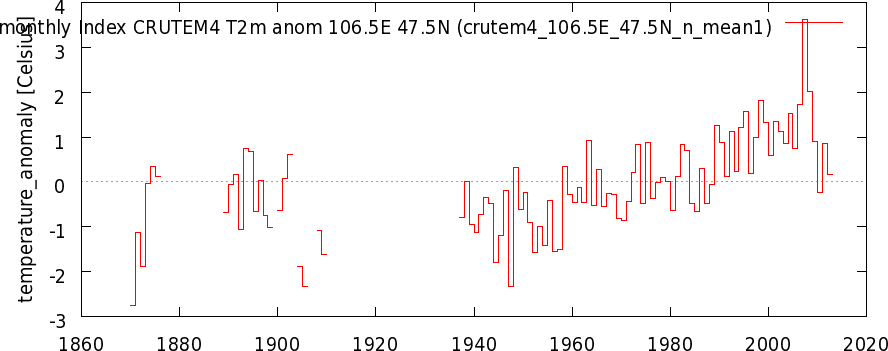
I was alerted to an article on climate change in Mongolia which claims that temperatures there have already risen by more than 2C since the 1940s. A few minutes on Climate Explorer allowed me to check.
Of course the 2C target much loved by the UNFCCC process is for a global average, but the figures below show the available observations from CRUTEM4 for a single grid box in Mongolia for monthly (top) and annual (bottom) means. A linear trend from 1938 to 2011 suggests that temperatures have risen by more then 2C in that time, but the available earlier observations suggest that the 1940s may have been unusually cold, though this is not entirely clear.
This highlights the difficulty of defining a reference period for estimating such temperature changes. Nevertheless, temperatures in Mongolia have increased much faster than the global average over the past 70 years and may have passed a local “2C” threshold.
UPDATE (24/12/12): Neil Pederson reports that tree ring data from Mongolia suggests that 1940s were warm compared to pre-1900s.

 CRUTEM4 Mongolia temperatures – monthly (top) and annual (bottom). Figures made on the KNMI Climate Explorer.
Hi Ed,
some sort of late addendum. Regardless of what people think about the efforts of the Berkeley temperature team, they came up with quite a handy tool to pull out local information. For Mongolia in its entirety the two degree temperature rise seems a fairly robust feature: Regional Climate Mongolia
The apparent “breakdown” after 2007 is a pure winter phenomenon (2007/08, 2009/10, 2010/11, 2011/2012) in lockstep with the increased blocking frequency (also expressed in terms of negative winter NAO/AO).
Although at higher latitudes (and hence certainly not representative for the global land surface), it might help to constrain the lower end of our sensitivity estimates (ECS and TCR alike). As Isaac Held pointed out, it’s interesting to note in this regard, that GCMs tend to get the land surface temperatures right when they are forced with observed SSTs.
Thanks Karsten – interesting figure from BEST – it does look like a 2C increase for Mongolia. I wonder if this is the largest increase for any country? And how much of the change is forced an how much is variability?
Cheers,
Ed.
Geert Jan’s ERL paper (with you as a co-author) demonstrates that not only Mongolia is “affected”, but quite a large portion of the Eurasian region (though Mongolia seems to be the “warmest” larger country indeed). Funnily enough, the paper got published just the day when I commented here. For some strange reason I never compared CMIP3/5 model regional trends with observations myself. The agreement over land is striking … the disagreement over the oceans telling. I return the question, this time for land only: What is forced and what is the impact of SSTs (i.e. variability)?
For the oceans: Could it be that they mix heat down too efficiently between 0-700m, but underestimate the fraction of deep water formation (at the expense of heat storage in the upper part of the ocean) instead? As a result, the transient response would be effectively reduced. And so would the time the climate system needs to equilibrate. Well, quite hypothetical at this stage I guess …
Cheers KarSteN