The consequences of the Paris Agreement’s choice of the pre-industrial as its baseline have been discussed previously on this blog. This choice makes sense from a climate forcing perspective (as radiative forcings are measured with respect to a quasi-equilibrated state, and the well-observed recent past is not close to have finished responding to anthropogenic drivers). Looking back into the pre-industrial period, there are fewer instrumental observations of the temperature across the globe. So naturally our knowledge of the pre-industrial baseline temperature is uncertain.
Recent work, such as Hawkins et al. (2017) and Schurer et al. (2017), have looked to assess and quantify this uncertainty in light of future targets. The magnitude of this uncertainty, although small, becomes important when you consider the amount of warming left between today and the 1.5°C target.
Guest post by Chris Brierley (UCL)
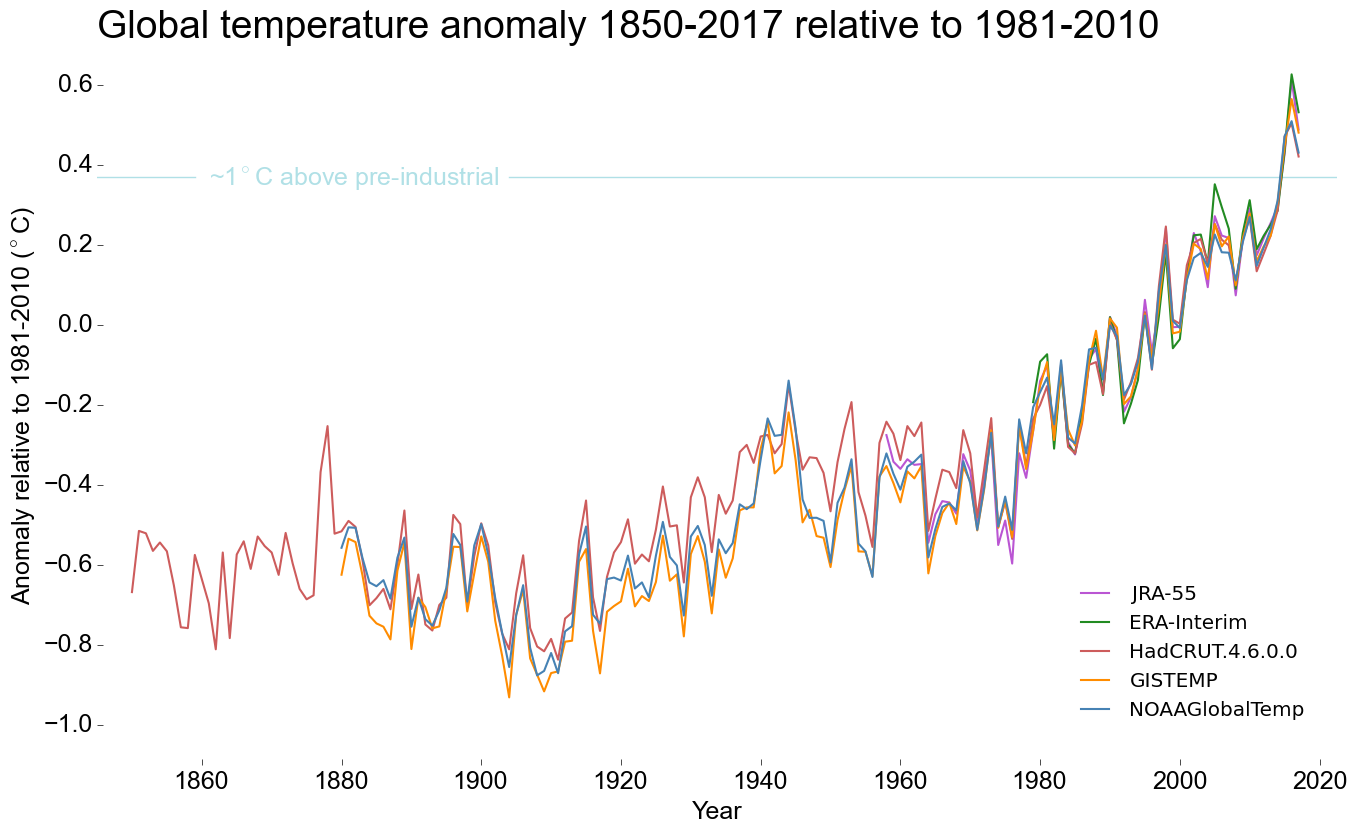
What I’d like to discuss in this post is how we should be visualizing global temperature changes to represent the uncertainty. For example, if you look at the recent WMO press release (below), the uncertainty is only implied by the inclusion of multiple instrumental datasets. The 1°C above pre-industrial is included as single horizontal line. The only nod to there being uncertainty in this perfectly horizontal value is a tilde (~) in its label.
So how might you go about considering the pre-industrial uncertainty? Firstly, we need to use a dataset with uncertainty. I’m going to use the new Ilyas et al. (2017) version of HadCRUT4 (which uses a multi-resolution lattice-kriging ensemble to estimate coverage uncertainty). All of the error bars here are 5-95% confidence intervals.
We compute the pre-industrial offset as combining the uncertainty in the 1850-1900 observational record with an additional component from the warming derived from climate model simulations. This component is roughly 0.1 +/- 0.1K, based on Schurer et al., 2017 which used model simulations to estimate the expected warming from 1400-1800 to 1850-1900.

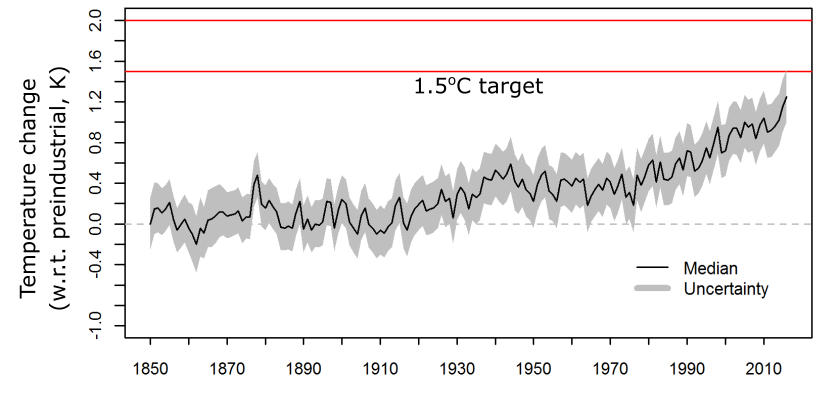
In its conventional presentation (above), we see the observations becoming less uncertain with time – as coverage increases and our observational errors reduce. We now dress the 1.5°C marker with an error bar relating to the uncertain pre-industrial offset. Personally, I don’t feel that the inclusion of pre-industrial uncertainty in the 1.5°C line works well. Instead, it looks as if there is some flexibility in the target itself. The spirit and ambition of the Paris Agreement’s text does not imply flexibility in the target – at least in my reading.
Alternatively, you could change the vertical axis of the figure to be “temperature above pre-industrial” (as below). This means that the uncertainty in the pre-industrial temperature must be folded into the temperature record, along with the coverage and instrumental uncertainties. This is a bit more challenging to compute, but it means that the 1.5°C target is now robustly represented as a single line. You get a rather different interpretation about our knowledge of the climate system from this figure.
What is immediately obvious from the new figure is that the uncertainty range stays pretty much the same throughout the past century – demonstrating the importance of our definition of the pre-industrial.
Could you explicitly mention what the baseline is for the term ‘pre-industrial’? You mention Schurer er al but not everybody may have read that (or has forgotten the details).
The Schurer paper advocates defining pre-industrial as the average between 1400-1800 CE.
The way they suggested doing this was to use the observed record to calculate the early instrumental value (so 1850-1900). And then use an ensemble of last millennium model runs to estimate the offset between this early instrumental value and the full 1400-1800 temperature. My statistics colleagues didn’t like just taking the 22-member last millennium distribution directly, so we resampled the offset with a kernal density estimator.
This was a good point Geert Jan.
Have added some brief details to the text, along with the range of 0.1 +/- 0.1K for the pre-1850 component.
Thanks,
Ed.
Hi Chris,
The uncertainty in the baseline is discussed in the provisional statement in slightly more detail (hopefully this link will work – it’s the link in the press release):
http://ane4bf-datap1.s3-eu-west-1.amazonaws.com/wmocms/s3fs-public/ckeditor/files/2017_provisional_statement_text_-_updated_04Nov2017_1.pdf?7rBjqhMTRJkQbvuYMNAmetvBgFeyS_vQ
At the end of the document there are “boxes” which discuss some of the choices that were made.
My personal preference is for the “conventional” depiction. The target is fuzzy because the chosen baseline is so uncertain.
The suggestion by Chris Brierley is one I have used in talks, but I am now inclined to think it is unwise to emphasize uncertainties and ambiguities in defining a baseline pre-industrial temperature level when discussing the climate system’s approach towards the temperature limits stated in the Paris Agreement. This is because the adverse impacts of climate change that the Agreement seeks to limit will occur when specific indicators reach specific absolute values rather than specific values relative to uncertain pre-industrial levels. If global mean surface temperatures estimated for the 18th or 19th century increase due to improved methods of analysis or recovered data, this should not make the Agreement’s temperature goal any easier to achieve, as the higher estimates do not change the risks we face now and into the future. By the same token, the warming that matters for avoiding or alleviating detrimental impacts is the net warming: if there is warming of natural origin then more stringent control of anthropogenic influences will be needed than would otherwise be the case, and vice versa.
What matters for the global temperature indicator is either that its absolute value is held below a particular level, or (if estimation of the absolute temperature is insufficiently accurate for stocktaking) that the increase in temperature above that estimated for a recent, relatively well-observed period, such as the 1981-2010 WMO reference period, is held below a specified level.
It will be for the Parties to the Paris Agreement to interpret the Agreement when periodically taking stock of the progress towards achieving its goals. In the meantime, alternative but equivalent statements of the temperature goal that use a specific fixed definition of the pre-industrial baseline can be discussed. Estimates of the global mean surface air temperature are around 14.2 to 14.3C for 1981 to 2010. Taking the mid-point of the 0.55 to 0.8C range estimated by Hawkins et al (2017) for the temperature increase from 1720-1800 to 1986-2005, and working to one decimal place, the 2°C goal of the Paris Agreement can be regarded as equivalent to a goal of holding the global mean surface air temperature (averaged over a suitable multi-year period) well below 15.5°C.
The above considerations do not obviate the need for better estimates of the anthropogenic contribution to warming over the industrial era. Such estimates are required to apportion responsibilities for past change and to evaluate climate models.
As the two degree limit was initially talked about in conjunction with 1850-1900, it is rather oblivious to set another base. “Hey, let’s set the base on the hottest plestocene interglacial so we can set the earth’s T to 18°C and then maybe cut back!” koyaanisqatsi.