Some of the biggest questions about the future climate we have are: “how much could the climate change this century?”, “how reliable are climate projections?” and “what could happen on the way to 2100?” Also, most people want to know about regional change rather than change to the global mean climate. We have recently produced two papers relevant to these questions in terms of temperature change, now available (one on limits to temperature change this century and another on regional projections and variability).
Guest post by Michael Grose, CSIRO
Limits to change by 2100
The first paper looks at the limits to forced temperature change this century for the globe and for Australia. To constrain the estimate of warming for a given emission scenario, an important factor is climate sensitivity. We still have a broad range of estimated Equilibrium Climate Sensitivity (ECS), with IPCC AR5 giving the likely range as 1.5 to 4.5°C/doubling of CO2 (where likely means >66% chance) and a <5% chance of being 6°C or more. Until we can reduce this range with confidence, then we must take the full range as plausible (including values outside just the likely range). Importantly, the CMIP5 models show a range that doesn’t systematically sample this space (model range of ECS is 2.1 to 4.7°C/doubling of CO2).
To make use of the full sample of climate models available but also explore the full range of sensitivity estimates from various lines of evidence, we adopted a simple scaling approach. This means scaling simulations up or down by the ratio of the model sensitivity to a specific sensitivity. This simple method assumes a simple relationship between sensitivity and temperature change, which we acknowledge is not ideal, but we feel the method is useful to explore broad patterns.
An example of global results are shown below, putting scaled results alongside the familiar AR5 projection series (results are similar for Australia, see paper). We find that scaling CMIP5 simulations to the likely range of ECS expands the global temperature projection over the 21st Century from 2.6 to 4.8°C to 1.8 to 5.2°C for the high emissions scenario RCP8.5, with change of up to 6.4 °C if ECS is 6°C (and even more if we assume a proportional scaling). For the ambitious mitigation scenario RCP2.6, the range expands from 0.3 to 1.7°C to -0.3 to 2.1°C (values of up to 2.7°C if ECS is 6°C). Some of these values (including a negative change) may be unrealistic given the simple scaling approach.
Given the warming we have seen to the start of this century, these results indicate that global warming from pre-industrial to 2100 would exceed the COP21 pledge of 2°C under RCP8.5 for any plausible estimate of climate sensitivity. In fact, sensitivity would need to be less than that expected if climate feedbacks were zero and we simply had the change in radiation balance for warming to remain under 2°C. The results also suggest that exceeding 2°C global warming by 2100 since pre-industrial is possible under RCP2.6 if ECS is 2.5°C or above.

How reliable are regional temperature projections?
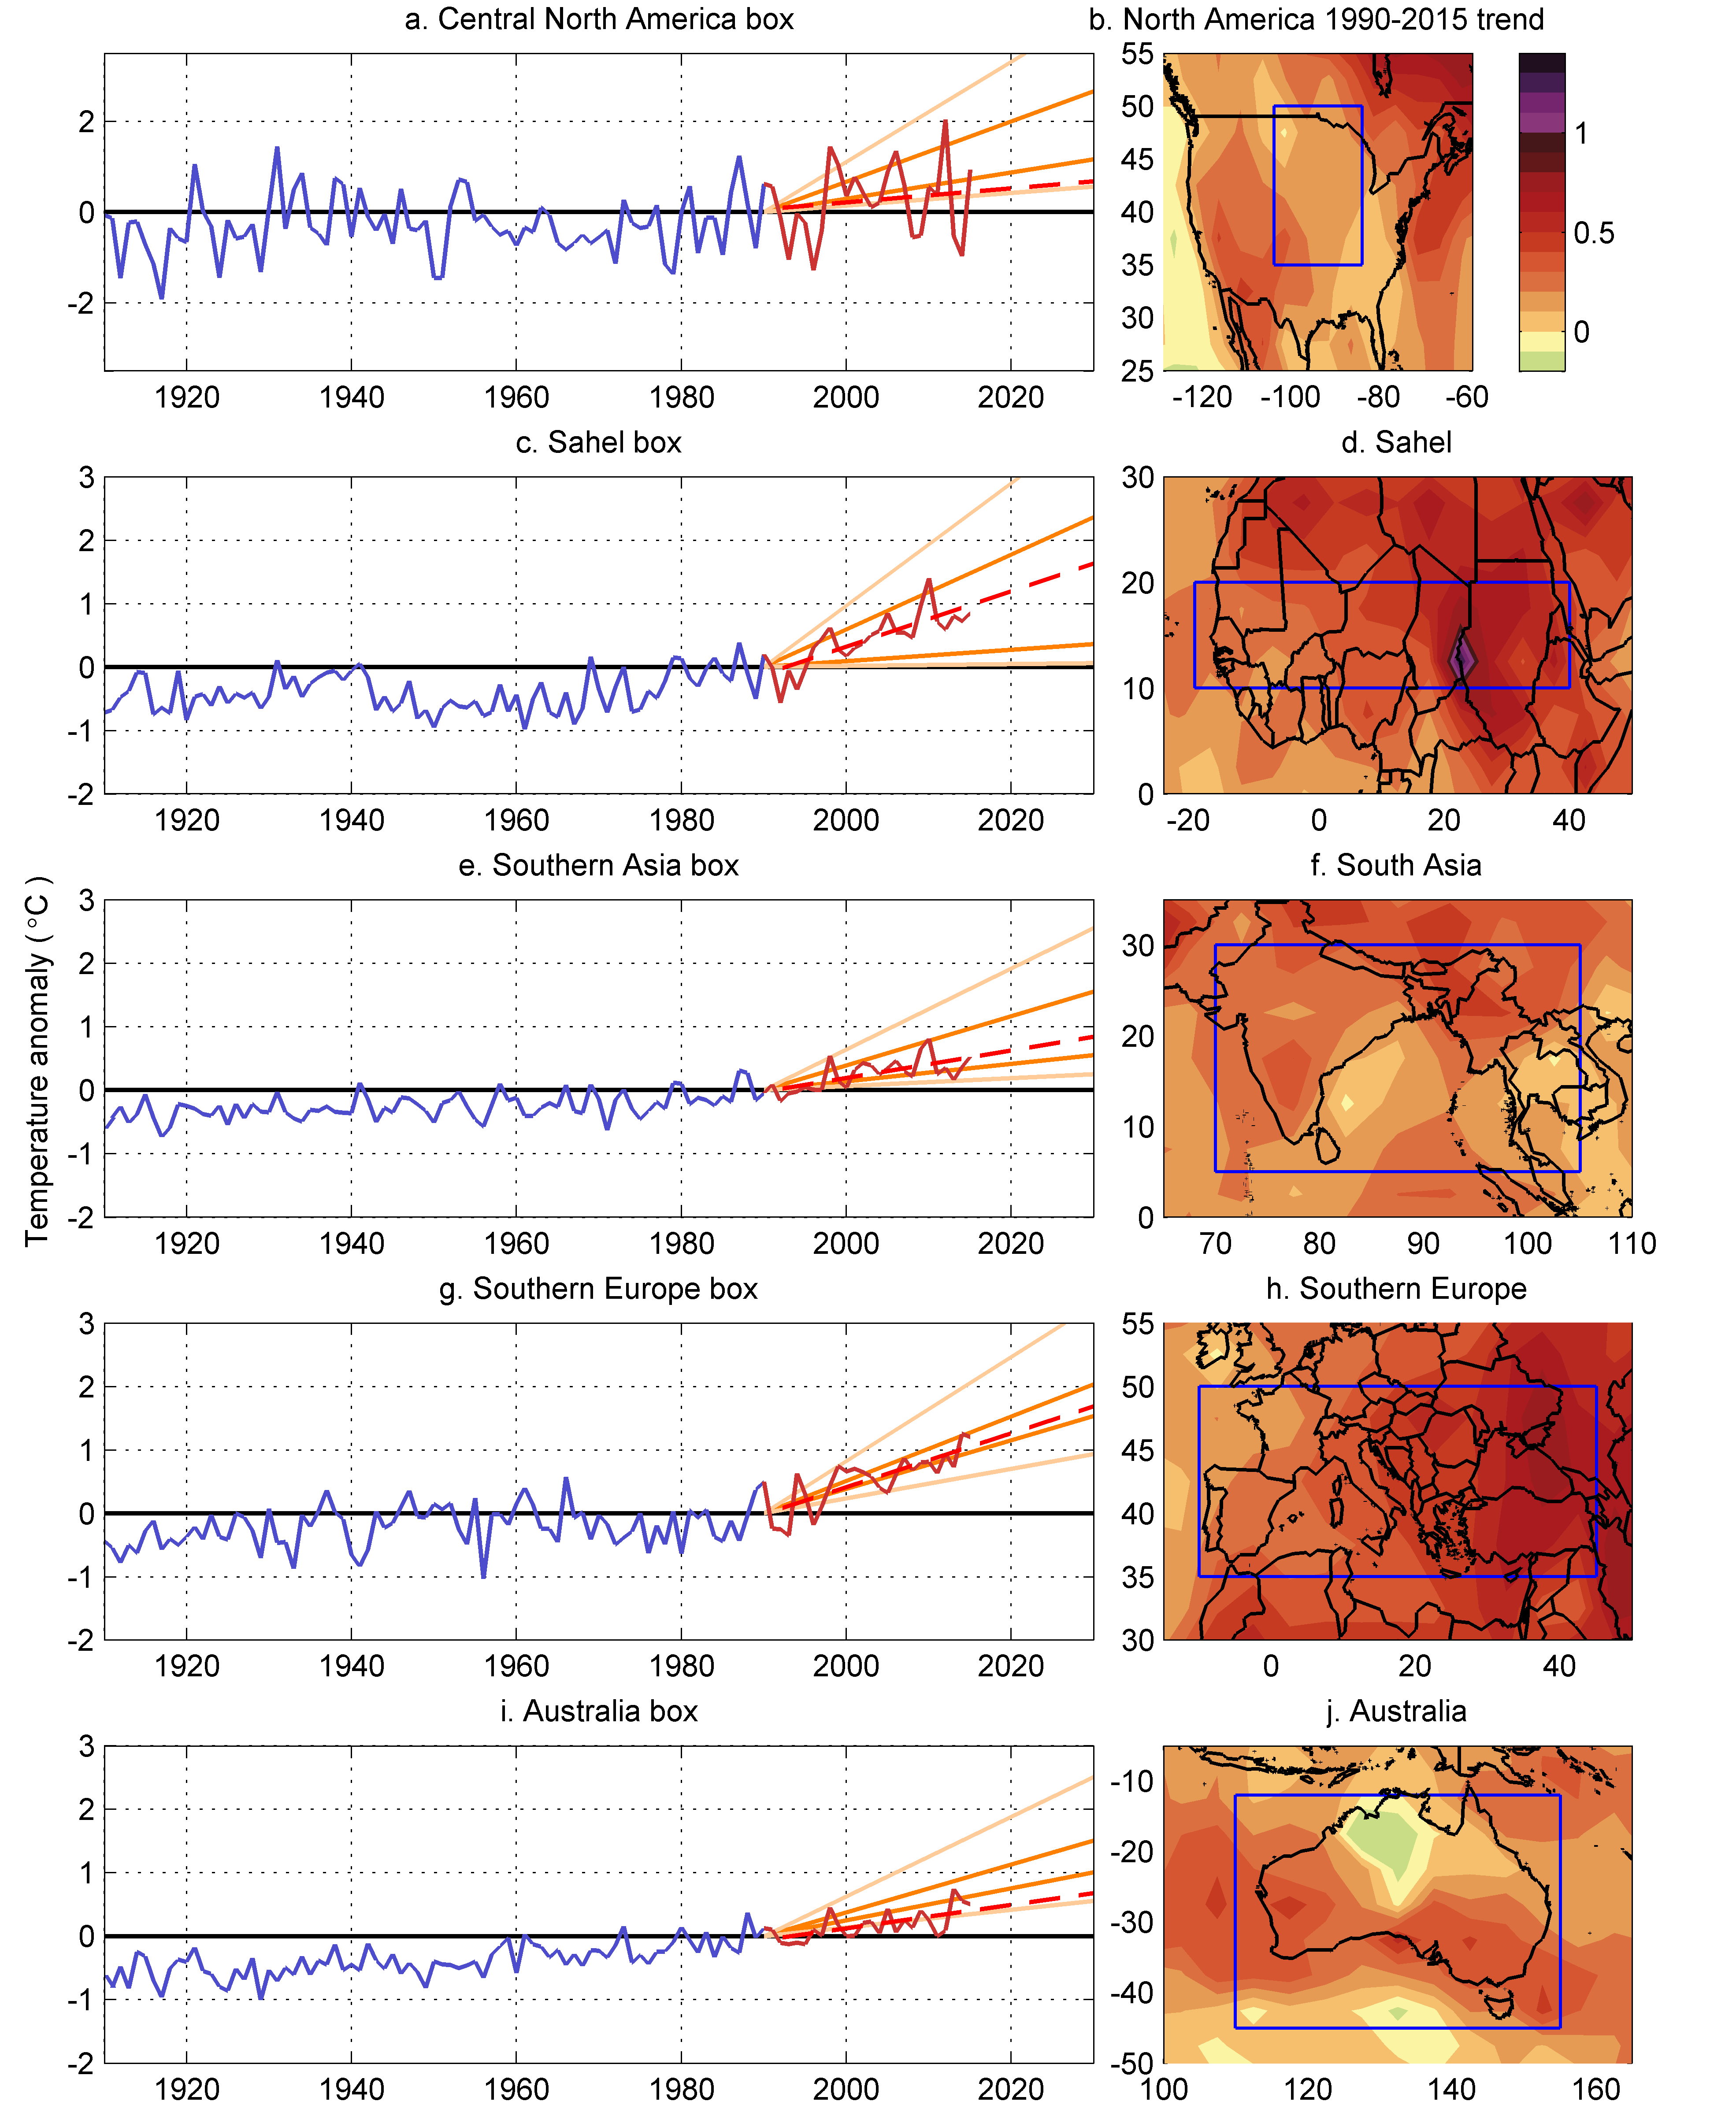
In the second paper we examined regional temperature projections from the early 1990s: the IPCC First Assessment Report (FAR) projections for various regions around the world and the CSIRO 1992 projections for Australia, to see how well they are faring to date.
We examined the 40-year projections of change between 1990 and 2030, and compared this to the ~25 years of observations we have in the interim. Projections from this era were made using a very small number of mostly slab-ocean models (typically, 50m deep oceans with assumed unchanging currents and overturning) with very coarse atmospheric resolution. IPCC FAR projections were scaled to a best estimate of global warming based on an ECS value of 2.5 °C, noting the range would be broader if this scaling was removed. Climate projections (as opposed to predictions) can only be evaluated on how they replicate the forced climate change signal, independent of natural variability. Even 25 years is too short to properly assess climate trends, but this examination is done to see how we are tracking the projections to date, and see what we can learn about our expectations of climate projections.
Here we compare projections displayed as a simple linear change between 1990 and 2030 to Cowtan and Way V2.0 observations (we chose this dataset to give us complete spatial coverage). Observations are tracking near the middle of the IPCC FAR range for the Sahel, Southern Asia and Southern Europe (see below). Observations are currently tracking below the reported range for Central North America and Australia, but within the projected range if we remove the scaling the FAR applied. Looking at the CSIRO 1992 projections (not shown), observations for Southern Australia are tracking near the middle of the projected range, but at the bottom of the range for northern Australia. North America and northern Australia have contained regions that have had a negative temperature trend for multiple decades, discussed below.
While this comparison is not a formal evaluation, it does indicate that the regional temperature projections from the early 1990s are generally proving to be a useful guide to change between 1990 and 2030, even for this interim period, with important regional exceptions. These results suggest we need to more clearly set reasonable expectations of climate projections, not only countering the idea that climate change means hotter temperatures year-on-year, but making it clear that some places will see marked variations of decades or more.
Regional variability
To understand how regional temperature will evolve over time, and to set reasonable expectations about the coming decades, we need to understand how forced change and variability combine and play out. Variation in global mean surface temperature is important and has received a lot of attention. Variability is generally higher at the regional scale, so giving this context is even more important for regional climate and projections. As part of the second paper, we looked at regional variations in warming rates, looking particularly at periods of negative trend, sometimes called ‘warming holes’, as this is relevant to tracking climate projections. We looked at periods of 25 years (the length of the observed record since the FAR projections) and 40 years (the length of the projections examined above).
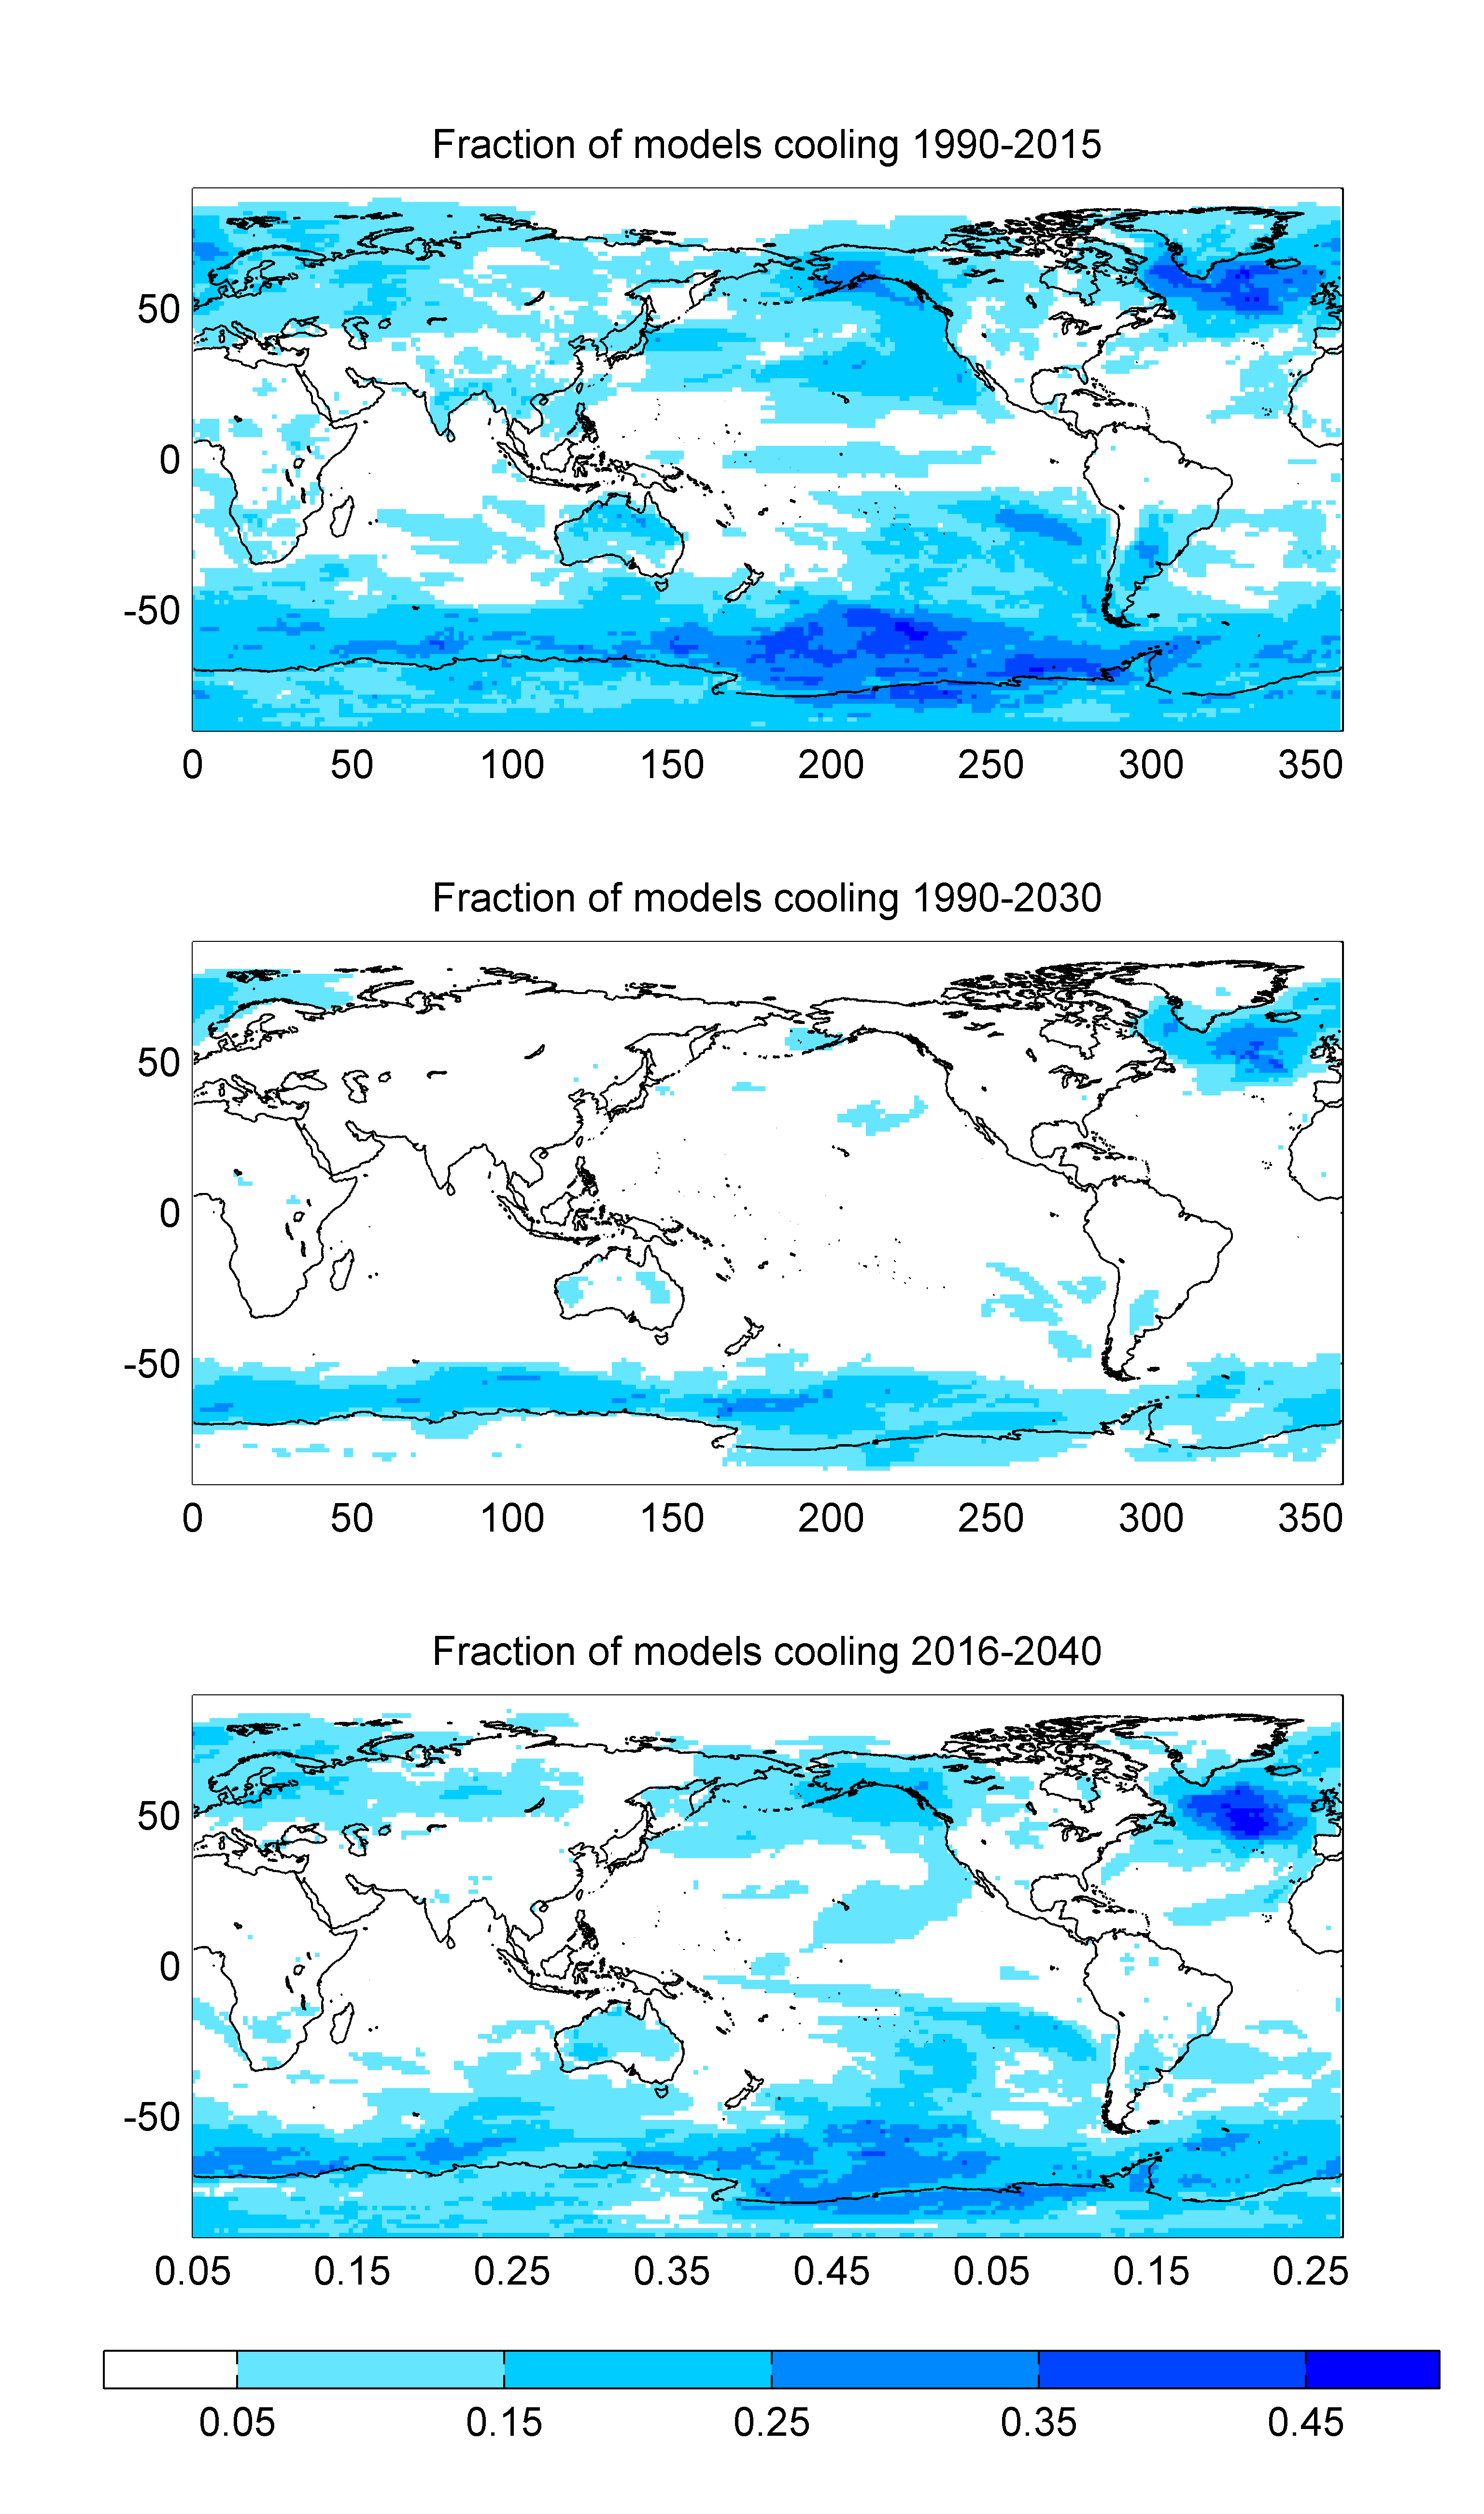
We found that some regions experience periods of cooling at this timeframe even when global temperature is increasing rapidly. Cooling periods of 25 years duration occurred in 13 to 74 % of the earth surface through the observed record, and cooling periods of 40 years occurred in 6 to 71% of the earth surface, including in the most recent decades. Cooling periods are more prevalent where the long-term trend is low such as in the Southern Ocean, and/or where decadal variability is high such as Pacific Ocean regions influenced by the Inter-Decadal Pacific Oscillation (IPO). However, there are cases where low trend or high variability due to the IPO (or Atlantic Multi-decadal Oscillation) are not the only factors, and there may be a role for forcings and other regional effects. These cases include the well-known ‘warming hole’ in the south east US through the last half of the 20th Century (noting this ‘hole’ has an important seasonal aspect to it) and the recent cooling in northern Australia linked to increasing cloud and rainfall.
We used the fraction of CMIP5 models showing a negative trend as an indication of where these cooling periods are more likely. In parts of Australia, North and South America and Eurasia, more than 25% of models show a regional cooling in the 25 years since the FAR, and more than 15% of models show cooling for the next 25 years (see figure). The longer period of 1990-2030 naturally shows fewer models showing regional cooling, representing a higher signal to noise ratio. Cooling of 25 years can be found in the Southern Ocean or North Atlantic in some models even in the last half of the century under a rapid global warming scenario of RCP8.5.
In the paper we raise the issue that if the term ‘warming hole’ is to be used and have utility then it needs a stricter definition, including the duration and size to qualify as a ‘hole’. More broadly, it would be useful to define whether the term should refer to negative trend (cooling) or a rate of warming lower than the longer term trend, and whether the term should be applicable only where there is a minimum rate of longer-term warming (e.g. the Southern Ocean has a low rate of warming, so perhaps the term is not useful here). Also, if ‘hole’ is to be a term, then we should have a term to describe the opposite (a warming ‘peak’ or ‘surge’), as variability occurs in both directions.
Overall, the results from our two papers suggest the range of possible temperature change this century is broad, and estimating the possible outer limits to change this century means accounting for possibilities beyond just the CMIP5 range and beyond the likely range of climate sensitivity. A constraint on sensitivity would of course be a very useful thing, but even given our current broad estimate of climate sensitivity we see that high emissions leads to >2 °C global warming. The results also suggest that even the earliest regional temperature projections are proving to be useful, on condition that the correct context of regional decadal variability is understood. In particular, marked regional variability should be expected, especially in regions such as Australia and North America, and that we need to carefully communicate this context when discussing past and future climate change. It is important that the community at large have reasonable expectations about climate changes, and that a cool year or even 25 years of cooling temperatures in some regions are entirely within our understanding of a warming global climate.
Many thanks to co-authors on the papers: Rob Colman, Jonas Bhend, Aurel Moise, James Risbey and Penny Whetton
Especially when you go into regional details, please consider that also the observed trends can be wrong and that deviations do not have to be due to the model.
On a global level 25 or 40 year averages seems too short to smooth natural variation, but 60 year does it relatively well:
http://woodfortrees.org/plot/hadcrut4gl/mean:300/plot/hadcrut4gl/mean:480/plot/hadcrut4gl/mean:720
The question is, would the regional variability largely disappear if 60-year trends were used instead of 25-40 year trends?
During the last maximum continental ice age it appears the Artic ocean was relatively warm and ice free. This would explain the source of abundant moisture to grow the continental ice sheet for eighty thousand years. Was this a change of Pacific Ocean currents? A very short comment would be appreciated. Thanks.