Communicating climate variability has become an important issue with the recent slowdown in global surface temperature rise. Below are some examples of different aspects of communicating these issues, with a focus on regional spatial scales, but more examples would be welcomed! What works, and what doesn’t?
Practical demonstration
Take a shuffled pack of playing cards with red cards representing ‘warm’ years and black cards ‘cool’ years. When dealing the pack there will be times when several warm or cool years appear together. Next, remove some black cards from the pack, and reshuffle. This pack now represents a changed ‘climate’ with less cool years. When dealing the pack for a second time, there will be more periods of warm years, but probably periods of cool years as well. Even though the climate has warmed, every year need not be hot!
[Taken from Hawkins (2011, Weather) (or author’s open access version)]
Trend and variation animation
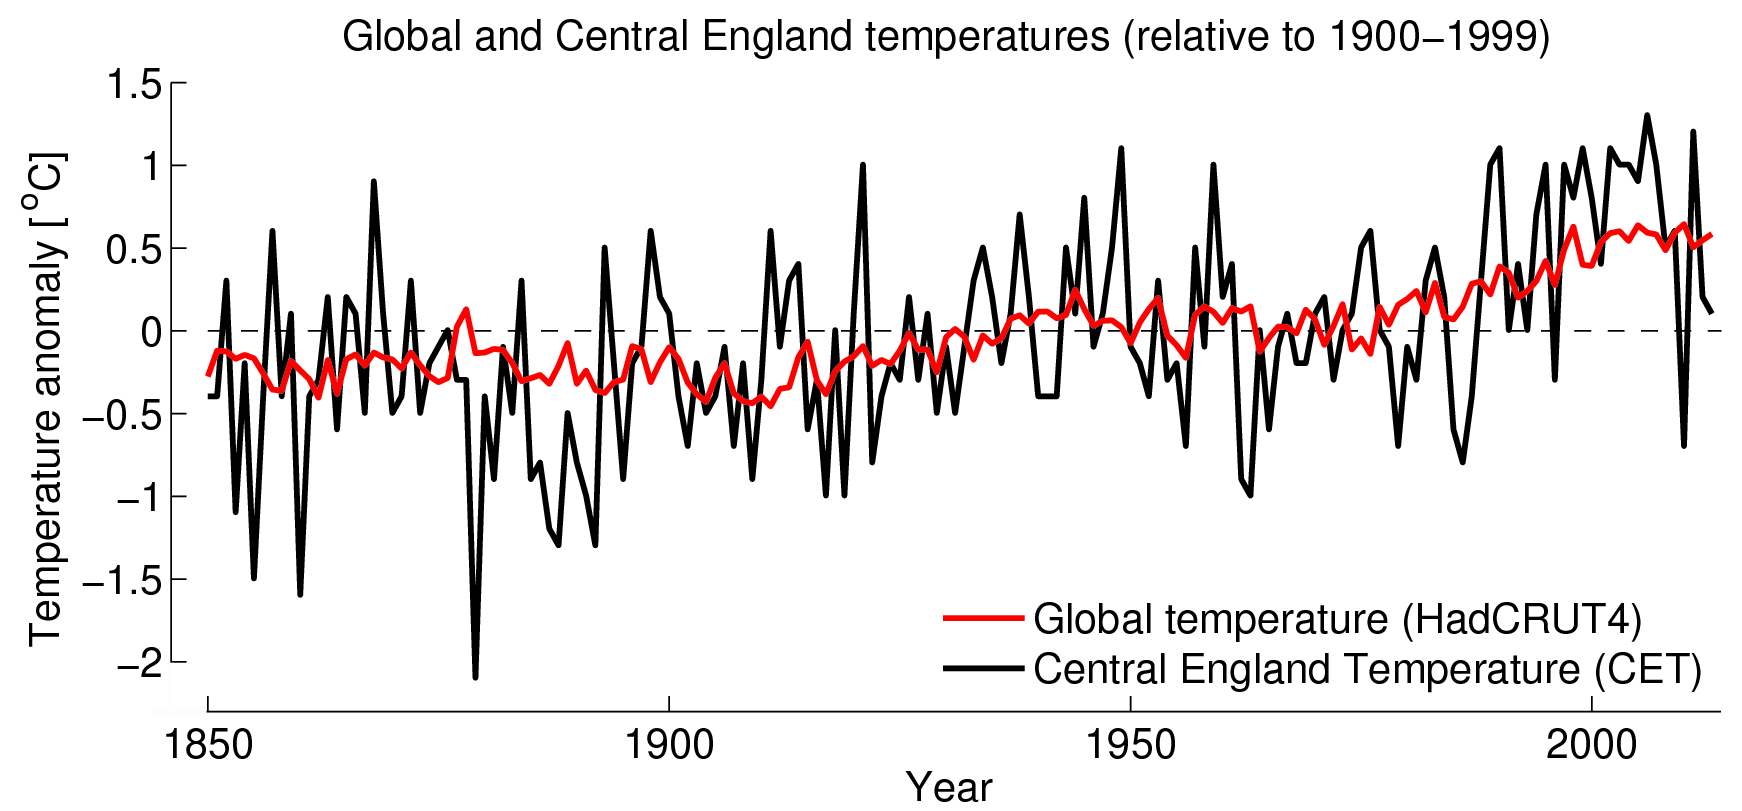
How variable is local temperature?
The figure below compares global temperature variations with local temperature variations, specifically Central England Temperature, on the same scale. This highlights how although local temperatures can follow long term trends in global temperatures, they have far larger variations, and this is an example of why local temperatures are not representative of the globe in any particular year.
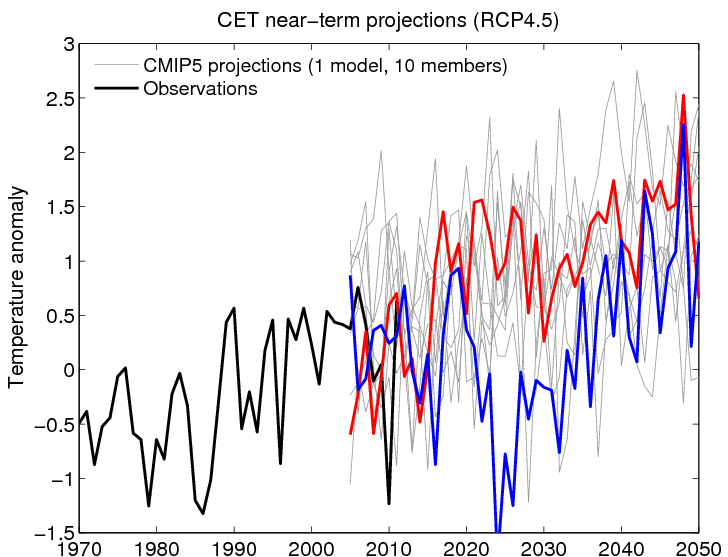
What is the range of possibilities for CET in the future?
Given the variability shown above, what does this mean for the future? The figure below shows ten simulations with the same climate model for the coming decades, each with a different evolution of temperatures. For Central England this results in very different possible trajectories for the future, even though they all warm in the long term. Similar examples are also described here and here.
When there are local cold anomalies, presenting a map with
the corresponding warm anomalies (and v.v.) was well-received. For
instance in the winter of 2009/2010 such a map showed the classical NAO
quadrupole with warmer weather in North Africa and the Middle Eats
and northern Canada and Greenland. This was picked up quite well by
the media, with the explanation that northerly winds in our region
must be compensated by southerly winds somewhere else (for
barotropic flows).
Thanks GJ – agreed that this type of presentation is very useful!
cheers,
Ed.
I prefer to use low pass filters to achieve a better view of what has happened and then Savitzky-Golay as a projection for the future (verified against the LP to ensure probability). It will always be wrong of course and overshoots most inflexions but all crystal balls have their flaws 🙂
http://climatedatablog.wordpress.com/cet/
Ed
If you look at CET data from 1650 onwards you find a general warming trend of 0.026C/decade which doesn’t seem to have increased much in recent times. Furthermore if you then look at H4 anomalies calculated just for stations in UK and Ireland then you find no significant warming since 1940
see graphs here
So there seem to be plenty of black cards left at least for the UK !
In Ireland Met Eireann recently upped their temperature averages by 0.4C, stating the local average had increased by that much since the mid-20th century.
So speak for yourself. 🙂
I reckon Ireland’s temperature must simply follow the sea surface of the Atlantic !
Clive,
The HadCET linear trend from 1700-1900 is flat to slightly negative. That’s quite the hiatus in a general warming trend.
The linear trend for the most recent century (1914-2013) is about 0.085ºC/Decade.