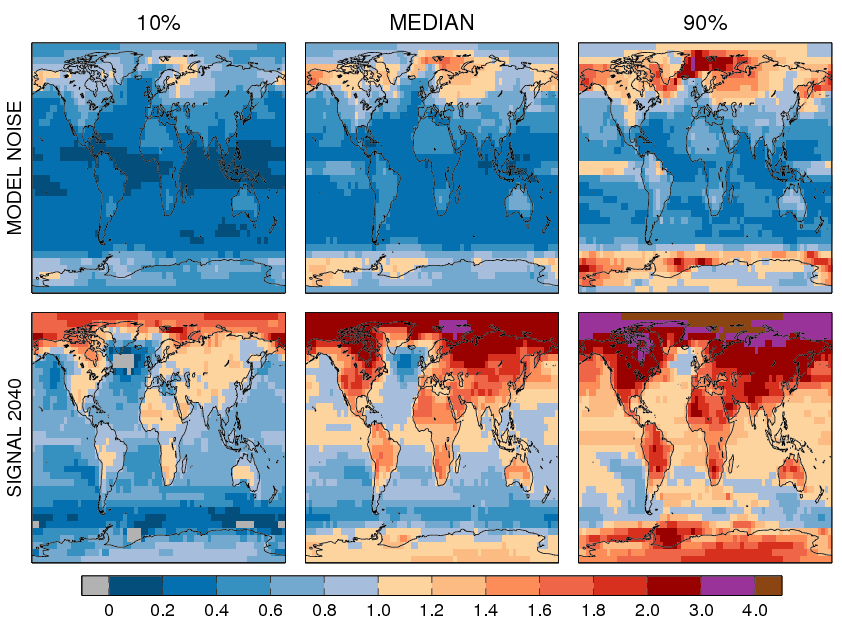
It is well known that there is considerable uncertainty in the projected response of climate models to increases in radiative forcing. However, there is also considerable uncertainty in the model simulated internal variability.
The top row of the figure shows the ranges in simulated variability (standard deviation) in annual mean surface air temperature from 15 GCMs – the differences are considerable – up to a factor of 9 in variance in some regions – in a similar way to global mean temperature. This can be compared to the range in the signal of response to prescribed radiative forcings at 2040 (bottom row) which is also considerable.
Both of these uncertainties play a key role in determining the signal-to-noise of any climate change, which is a key metric for climate impacts. We are uncertain in both the signal and the noise. When comparing with observations, the median model is slightly too variable in general (not shown here).

One thought on “Uncertainty in temperature variability”