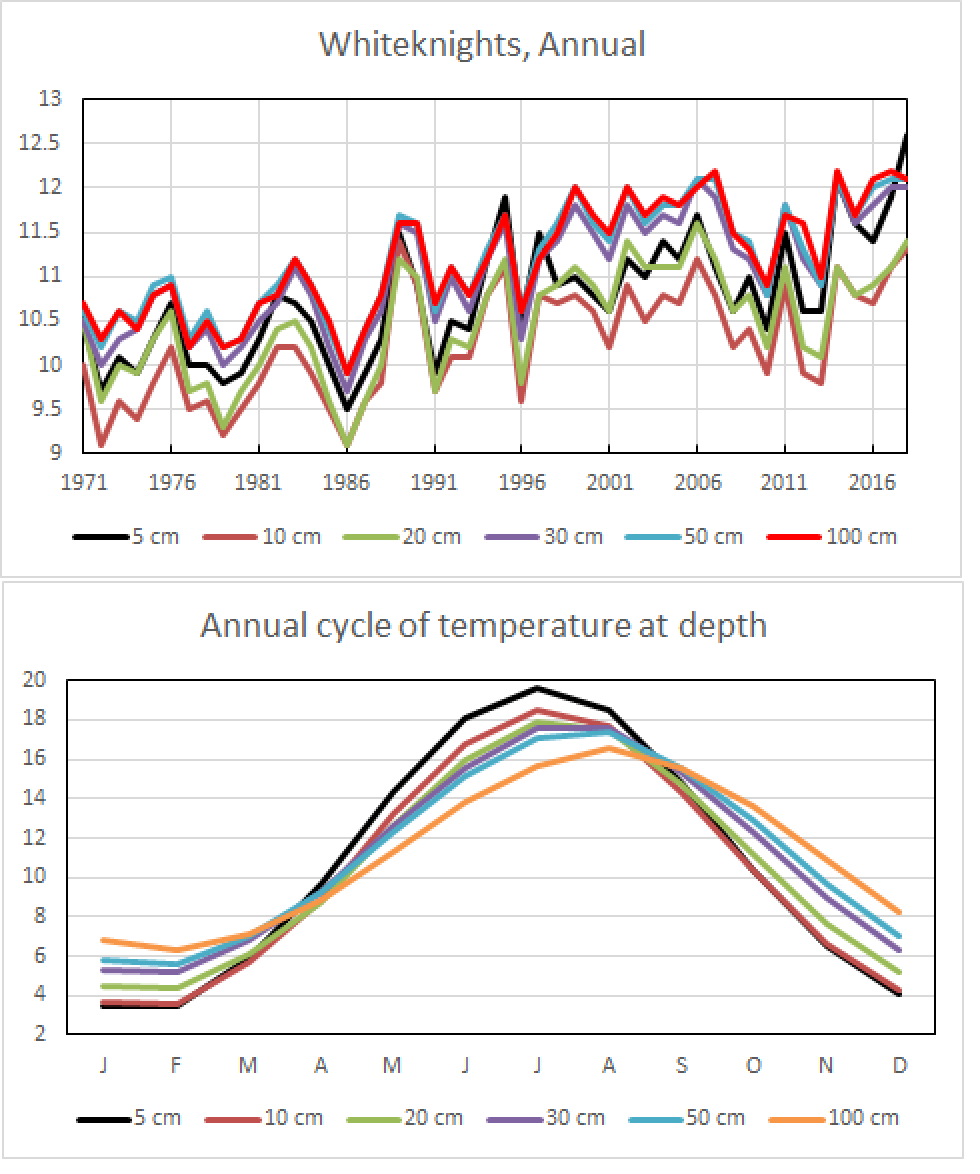
It is not just air and ocean temperatures that are warming through climate change – the soils are warming too. At the University of Reading we have monitored underground temperatures every day since 1971 from 10cm to 100cm depth. There is a clear warming observed at each depth
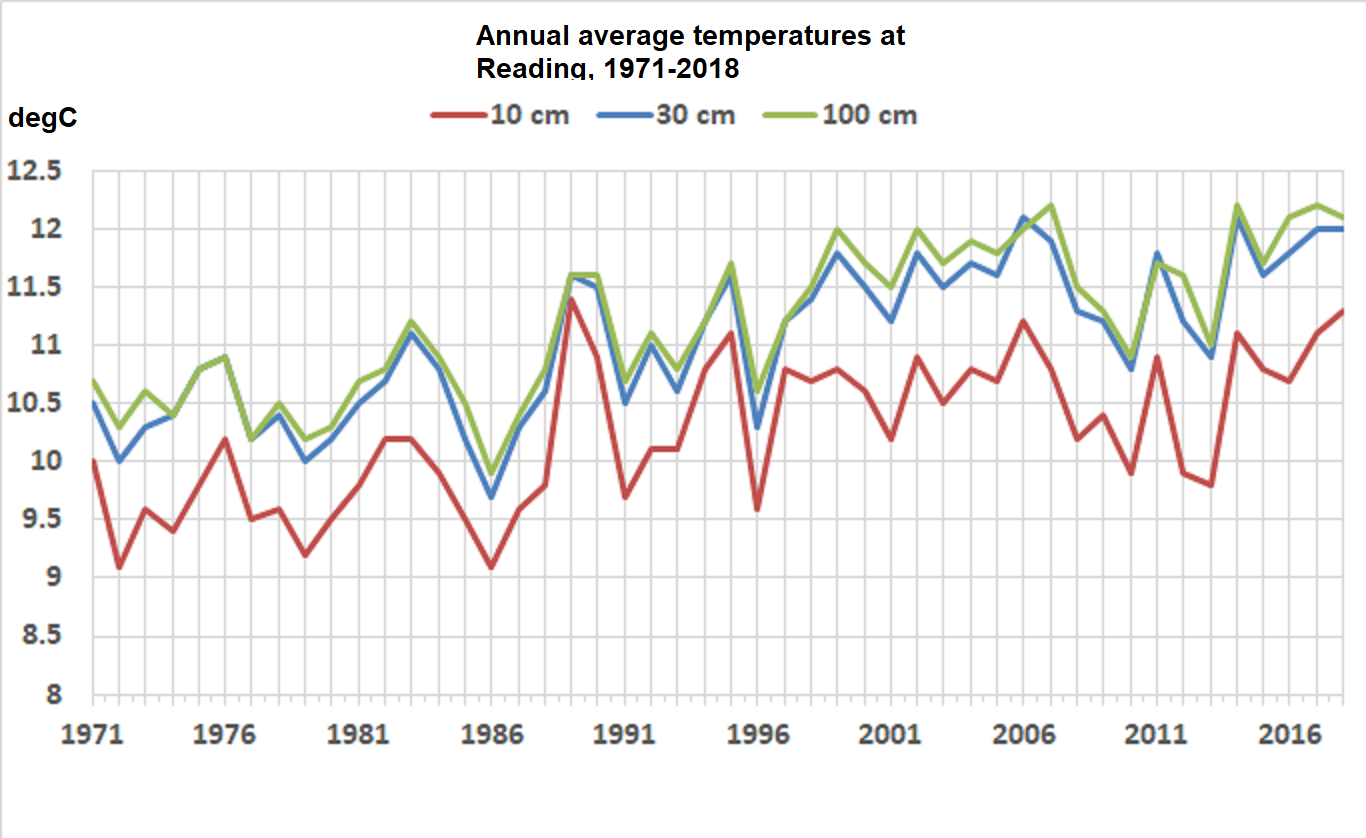
The time series for 30cm depth can be extended back further to 1941 using observations from nearby sites – Maidenhead, Hurley and an older University campus (London Road*). The variations between overlapping site records are very consistent and more than 1.5°C warming has been observed overall in the last 80 years.

(Added 12th October 2019)
Data for other depths exists also. The seasonal cycle shows how different depths respond to the seasons, with deeper depths being lagged compared to the surface and smaller variations over the year. 10cm depth is coolest in the annual average, with 50-100cm being the warmest.
Graphics and analysis by Roger Brugge, University of Reading.
* Note the London Road campus is about 0.5°C warmer than the other sites, and this difference has been corrected for in the black line.
Just a question, please: I do not understand why the soil temp at 10 cm depth (red) are colder that at 30 and 100 cm?
Are the surface soil records biaised by the extreme winter temperatures?
Would you have records for mean end of summer and winter (max and min smoothed monthly records)?
Much sincerely
Laurent
Thanks – will see if I can find a graphic for the seasonal cycle at each depth.
Many thanks, Ed. Very comprehensive.
Any idea how this amount of change (or more) affects the most common crops grown in these areas?
Here is another long-term (64 years) soil temp study.
A Rare Long Record of Deep Soil Temperatures Defines Temporal Temperature Changes and an Urban Heat Island
https://link.springer.com/article/10.1023%2FA%3A1005453217967
Abstract:
A long-term set of deep soil temperature data collected over a 64-year period beginning in 1889 in a rural Illinois area provide a rare opportunity to assess the natural shifts in temperatures in a pristine environment without any urban or instrument bias. Temperatures from 1901 to 1951 increased 0.4 °C, and this was 0.2 °C less than nearby values from two high quality surface temperature data sets that supposedly are without any influence of urban heat islands, shifts in station locations or instrumentation, or other changes with time. Comparison of the soil values with surface air temperatures from a nearby weather station in a growing university community revealed a heat island effect of 0.6 °C. This value is larger than the adjustment based on population that has been recommended to eliminate the urban bias in long-term temperature trends in the U.S.
Collectively, the results suggest that additional efforts may be needed to eliminate the urban influence on air temperatures, beyond techniques that simply use population as the basis. Population is only an approximation of urban factors affecting surface temperatures, and the heat island influences inherent in the values from weather stations in smaller communities which have been used as control, or data assumed to be unaffected by their urban environment in the adjustment procedures, have not been adequately accounted for.
In 1980’s British gas had temperature records at different depths – they used them to correlate with mains breakages (predominantly during freezing temperatures). From memory, temperatures fluctuated more underground and faster in cities because all the kit in the ground is much more heat conductive than the ground itself.
I live at St Brieuc, Brittany (Northern France).
Basically, the soil temp 1 meter below the crawlspace floor of my house goes from 14°C in Jan, to 17°C in August. (True for 2017, 2018 and 2019).
However, this year I started heating the crawlspace with solar air as of 1 April.
The soil temperature has gone from 14.7° on 1 April, to 18.6°C at 9 August.
Average daily power input is 20 kW. Surface area of CS floor = 42 m2.
CS air temperature generally fluctuates between a fallback temp of 16.5 to 20.5°C over the year, and a collection temperature that is generally 2K higher. However this week I am seeing collection temperatures rise daily, currently over 23°C.
The heating air temperature goes from 22°C in the morning, to 30°C in the afternoon, and the external(ambient) air temp from 16°C overnight to 30°C or more in the day.
The collection period goes from 10:30 to 21:00 or so, using 2 x 90 W fans.
(The soil temp measurement point (in fractured schist) is actually 2.8 m below finished ground level).