There had been speculation that record low temperatures would be coming to the United States in early December, and this had been framed as either evidence against global warming in general or that cold air outbreaks are increasing due to climate change.
World Weather Attribution (WWA) presents a quantitative study of this cold air outbreak. WWA researchers compute how rare the outbreak was and how it is affected by human-caused greenhouse gases. The analysis uses the same methods as WWA used in the peer-reviewed analysis of the cold extremes in the Midwest in the winter of 2013 – 2014 (van Oldenborgh et al, 2015).
Guest post by Geert Jan van Oldenborgh (KNMI).
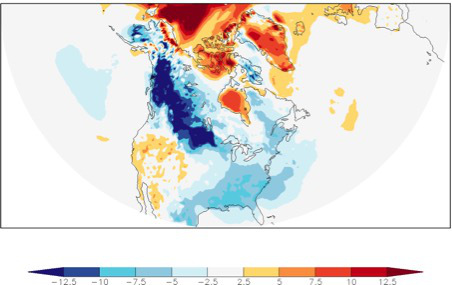
First, what is going on? The map below (Fig.1a) shows the daily mean temperature forecast for December 8th compared to the 1981–2010 average. Cold air (blue) is seen to flow south from Alaska down to the Rocky Mountains. The map highlights the day the coldest air extends farthest south.

A few days later the cold air was forecast to reach all the way down to the Southeast as shown below (Fig.1b), but with less intensity. Western Canada remained cold throughout.
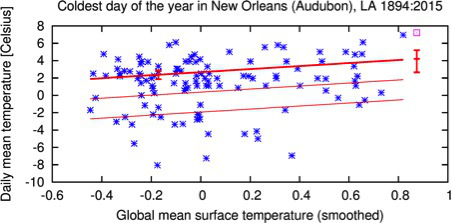
Such “cold air outbreaks” are a common occurrence in winter in North America. To determine how rare such an event is we consider two stations that are forecast to be in the center of the cold weather: Boulder, Colorado and New Orleans, Louisiana. Both these stations have daily observations going back to 1893, albeit with a few missing years.
The Boulder forecast for daily mean temperature on 8 December was 3.9ºF (-15.6 ºC). This is definitely a cold day, but not very unusual there: the coldest day of the winter is on average 3.4ºF (-15.9 ºC). Almost every other year has a day that is colder than the forecast. There is a positive trend in the temperature of the coldest day in the year (Fig. 2), but because of the big differences in weather from year to year it is not significantly different from zero.

In New Orleans (Fig 3), the forecast for 10 December was a daily mean temperature of just 45ºF (7.2 ºC). This is nothing unusual, it gets colder than that every winter. The coldest day of the year there has a very significant upward trend: cold extremes are now on average 3.2ºF (1.8 ºC) warmer than they were a century ago.
Cold air outbreaks are influenced by two main factors (de Vries et al, 2012): the frequency and intensity of cold northerly winds, and the temperature of the cold air from the Arctic. There are no indications that we are getting more, stronger or more persistent northerlies above the large variability from winter to winter (Screen & Simmonds 2013), whereas observations show that the temperature of the source regions of the cold air is increasing rapidly (Screen, 2014; van Oldenborgh et al, 2015).
Climate models confirm this analysis, showing a strong warming trend in coldest day of the year in the mid-latitudes. In these models this also reflects the strong warming of the Arctic. They also show little influence of the sea ice extent on the circulation over North America. While some research suggests that cold air outbreaks could have become more frequent as a result of melting Arctic sea ice (Francis and Vavrus, 2012), the majority of studies find no influence of sea ice at all (e.g., references in Jung et al, 2015). A recent paper by Screen et al (2015) finds that decreasing sea-ice cover results in fewer cold extremes over central and eastern North America. That said, there is some evidence for the sea ice decline strengthening the Siberian high somewhat (Mori et al, 2014) leading to colder extremes in that region (Screen et al, 2015).
In conclusion: the cold air outbreak forecast was nothing unusual, and neither inconsistent with an overall picture of a warming world, nor evidence that global warming is making cold weather more extreme. Such cold air outbreaks are, in fact, decreasing in intensity both in observations and climate models primarily because the source of the cold air, the Arctic, is warming strongly.
Analysis: Geert Jan van Oldenborgh and Hylke de Vries (KNMI), Myles Allen (University of Oxford)
Note: This post first appeared at Climate Central and will hopefully be the first in a regular series on event attribution.
References
Francis, J. A., and S. J. Vavrus, 2012. Evidence linking Arctic amplification to extreme weather in mid-latitudes, Geophys. Res. Lett., 39, L06801.
Jung, Th. et al, 2015. Polar lower-latitude linkages and their role in weather and climate prediction, Bull. Amer. Meteor. Soc., 96, ES197–ES200.
Mori, M., M. Watanabe, H. Shiogama, J. Inoue and M. Kimoto, 2014. Robust Arctic sea-ice influence on the frequent Eurasian cold winters in past decades, Nature Geosci. 7, 869–873.
van Oldenborgh, G. J., R. Haarsma, H. de Vries and M. Allen, 2015. Cold extremes in North America vs. mild weather in Europe: the winter of 2013–14 in the context of a Warming World, Bull. Amer. Meteor. Soc., 96, 707714.
Screen, J. A. and AI. Simmonds, 2013. Exploring links between Arctic amplification and mid-latitude weather, Geophys. Res. Lett., 40, 959–964.
Screen, J.A., 2014. Arctic amplification decreases temperature variance in northern mid- to high-latitudes, Nature Clim. Change, 4, 577–582.
Screen, J. A., C. Deser and L. Sun, 2015. Projected changes in regional climate extremes arising from Arctic sea ice loss . Environ. Res. Lett., 10, 084006.
de Vries, H., R. Haarsma and W. Hazeleger, 2012. Western European cold spells in current and future climate, Geophys. Res. Lett., 39, L04706.
The NCDC tells us that for the entire continuous US summers have been warming for the past 20 years while at the same time winters have been getting colder (-0.55°F/decade). Any thoughts on this counter-intuitive pattern?
Indeed, but there are two additional remarks that should be made here. First, this comes as part of a hundred-year trend towards milder winters (see eg http://climexp.knmi.nl/diagnose/UScont_winter.png). Secondly, this trend has been interrupted by shorter cooling periods before, most notably around 1960. This is reflected in a very low confidence level of the 20-yr trend 1996-2015, which indicates that there is a high probability that you find a negative trend like his even over 20 years even if the underlying trend is zero or positive, just because of random weather.
Finally, there is a big reporting bias. “Cold winter causes chaos” is a good headline, “Mild winter does not cause chaos” does not work so well.
I understand the longer-term trends. I was curious about the seasonal pattern and if you thought it reflected some oscillation. Eduardo Zorita has written that “This means that temperature trends have decelerated much more during the boreal winter months. Actually the trend over the last 15 years in these months is remarkably negative…”
http://klimazwiebel.blogspot.com/2013/09/the-intriguing-stagnation.html#more
“What is the spatial ‘fingerprint’ of the stagnation, or in other words, in which regions are the recent temperature trends more strongly subdued – or even become negative- and in which regions the trends continue unabated?”
He thinks the pattern may be associated with the NAO. Hence, my questions.
In general, the influence of the NAO on DJF Contiguous US temperature is modest (r=0.3). The trend pattern (http://climexp.knmi.nl/diagnose/t2m_trend_20yr.png) suggests that the cooling is due to a few more cold outbreaks at the end a few fewer at the beginning of the period. Winter weather over the continents is just very variable; and 20 years way to short to say anything about trends over land in that season.