Investigations into the recent observed slower rate of global warming have largely been focussed on variability in the Pacific basin. Climate models also show similar slowdowns focussed in the Pacific (e.g. Meehl et al. 2011).
But, is this the only type of simulated slowdown? How different can regional patterns of temperature change be for the same global change?
We have used the FAMOUS GCM to perform a large ensemble of simulations with increasing CO2 at 1%/year. In these ensembles it is possible to find many periods of 15-years with an identical global mean temperature trend.
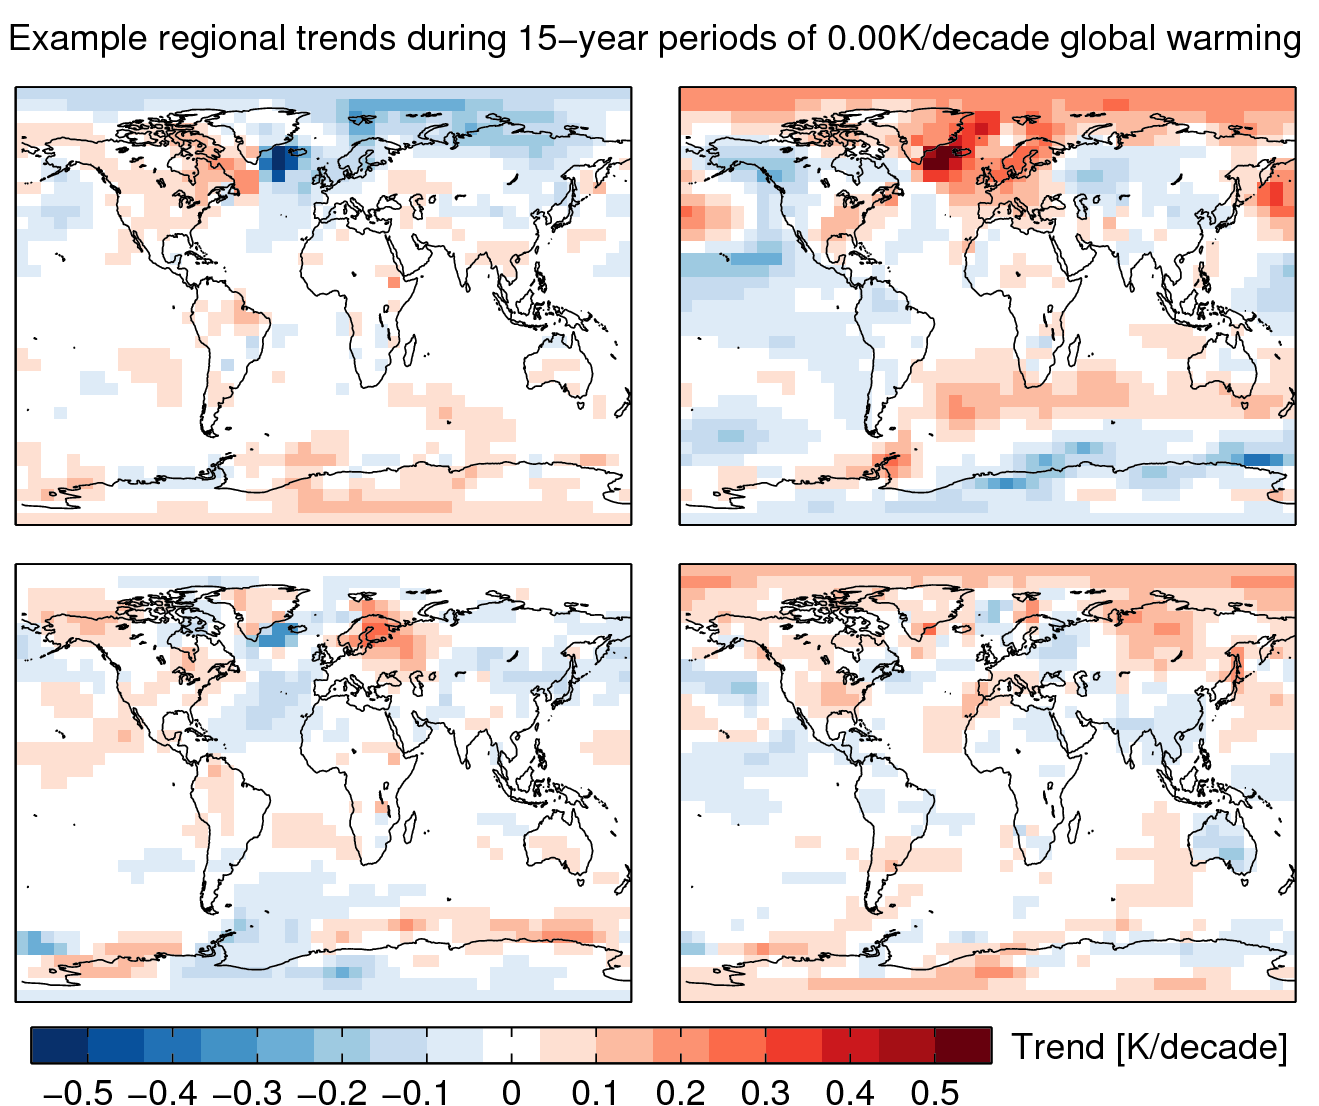
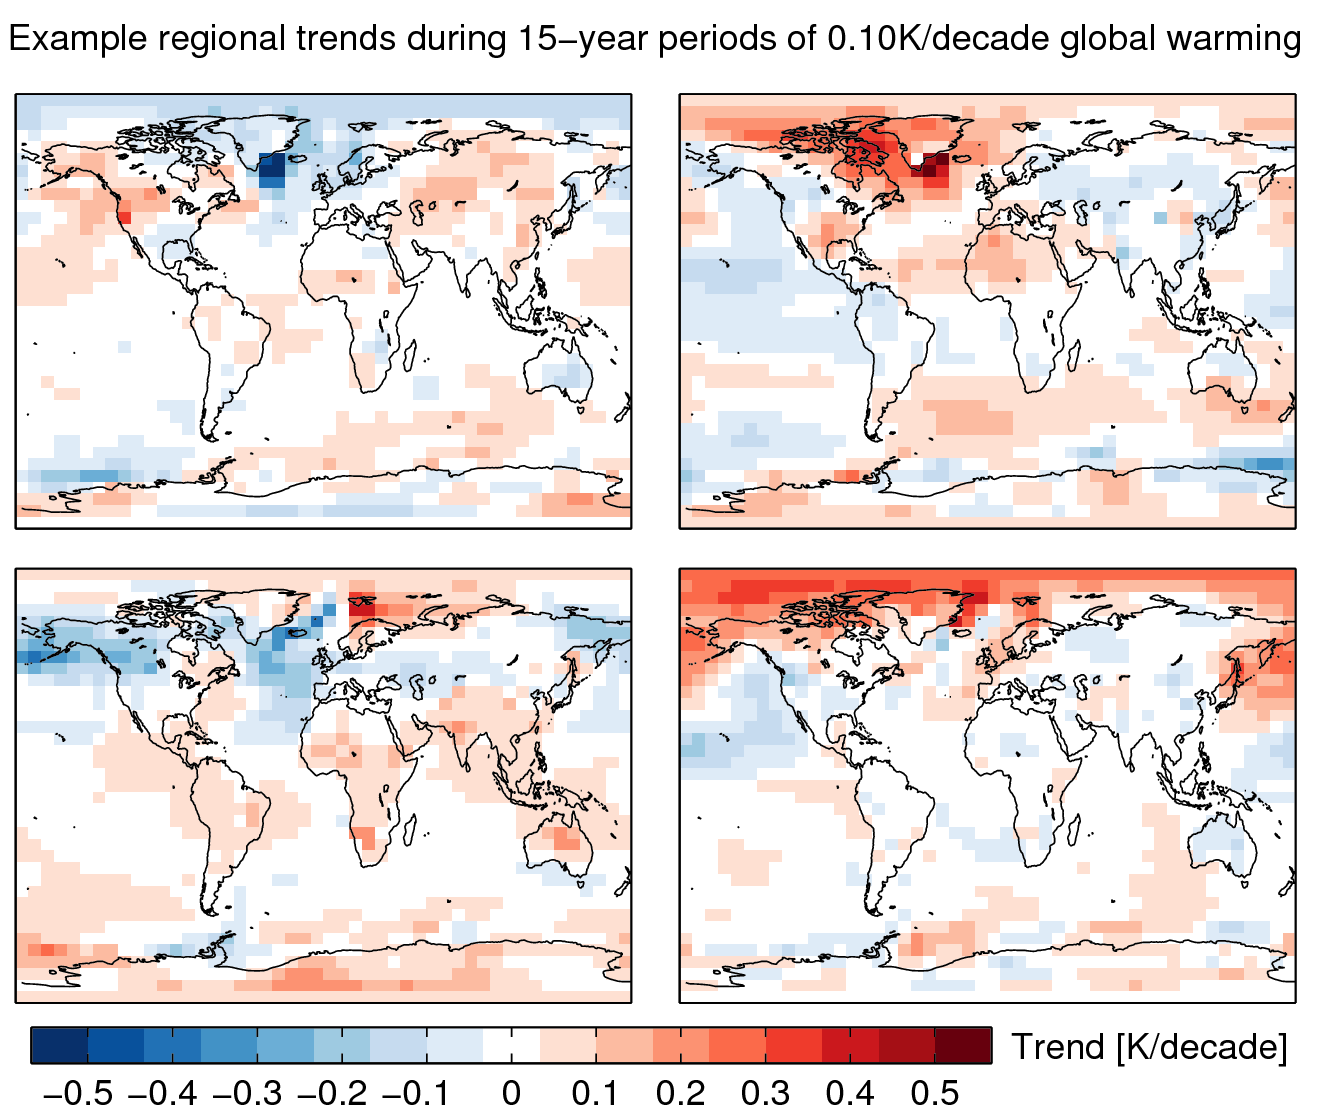
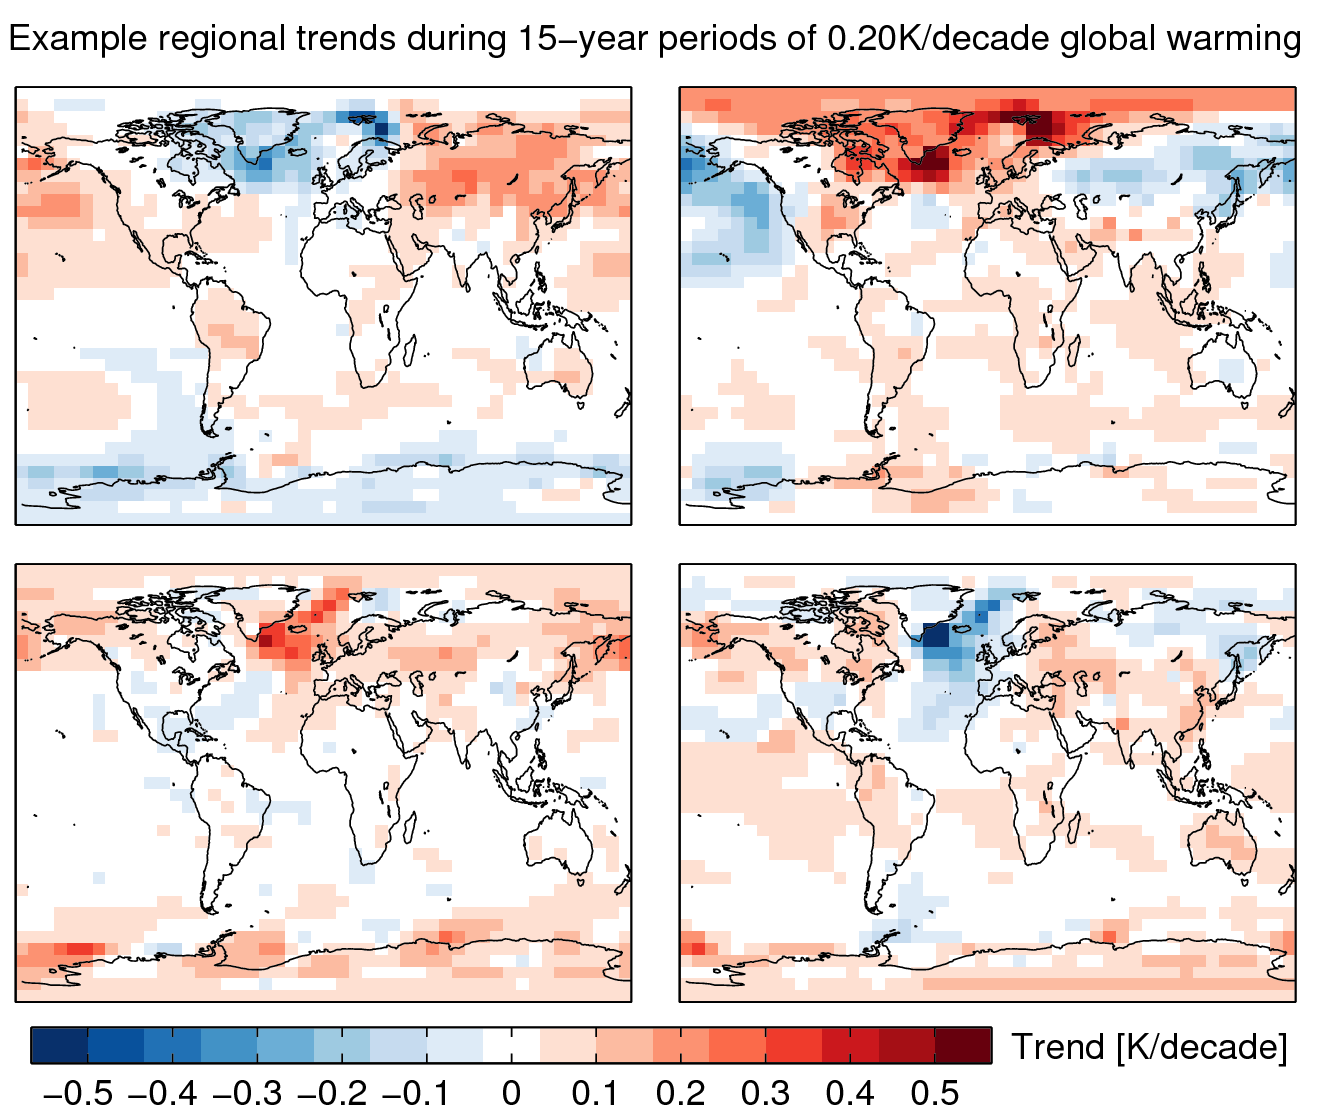
Fig. 1 shows the regional temperature trends for four different periods, each with a global mean temperature trend of 0.000K/decade. Figs. 2 & 3 are the same but for a global trend of 0.100K/decade & 0.200K/decade. The different periods have vastly different patterns, almost anti-correlated in some cases, even though the global trend is identical.
Of course, FAMOUS is only one GCM, which is rather simple by modern standards and has larger-than-average variability, but this diversity of trends is also seen in other GCMs (e.g. Deser et al. 2012).
This type of analysis also highlights the value of large ensembles of climate projections for quantifying near-term changes in climate. If you only had a handful of such simulated periods, you would not effectively sample the full range of plausible near-term trends, even if the precise global trend was known.
Welcome to the zoo of short-term trends!
Very good. If you have time it would illustrate the point of the post even better if you also gave us similar examples sets for same ºC/decade changes but for say 30 or 90 year periods – presumably more agreement is much more evident as period length increases?
Hi Paul,
Yes – here is the 30 year version for 0.200K/decade:
Much less diversity in patterns, but still different, especially in the Atlantic.
cheers,
Ed.
Ed, you are assumedly using a TCR of ~ 1.40 to get a 0.20 degree/decade T increase, since TCR is defined over 7 decades?
Also, have you done any longer term simulations–say a few centuries–looking at the time dependent relationship between transient forcing and transient T change?
Hi Jim,
TCR in FAMOUS is actually quite large – over 2K, and yes, we have done some longer 1% simulations, and see that TCR increases with radiative forcing. That analysis is currently under review actually.
cheers,
Ed.
I’d like to go down the road of Paul Price and look at some sort of controls in the experiment. You have a number of control runs ( no CO2 forcing)? Are there periods in those runs that match the warming rate of the earlier (1970s-1990s) warming phase? Periods of say 24 years with warming of say 0.18oC/decade or more (roughly Hadcrut4 from 1974-1998). Is there any phases of ‘internal variability’ in this model that roughly matches the warming phase of the real world thats attributed mostly to GHGs?
Hi HR,
Not looked yet – but will add that to the list!
Thanks,
Ed.
Ed, have you tried masking by HadCRUT4 coverage to see how trends are affected in each case?
No – but good idea – will add that to the list too!
Thanks,
Ed
Thanks Ed for the 30 yr version. As your other post on the simulations shows, once up to 90 years climate variation between model runs is very small indeed. This seems an important point in deciding on mitigation action.
Yes, as the timescales lengthen the signal emerges from the noise more clearly.
Good for adaptation decisions too.
cheers,
Ed.
I hope you don’t mind a novice’s comment: When the FAMOUS GCM simulates a 15 year pause in global mean temps, can the ’cause for the modeled pause’ be easily identified? (I assume there may be an energy sub-budget/balance recorded?) Is there a typical cause for these modeled pauses? Would these answers be different for different GCMs? Thanks.
Hi CS,
Good question – the pauses in FAMOUS do seem to be different. Some are due to ‘pauses’ in the Top Of Atmosphere net radiation too, suggesting changes to clouds are responsible. Others show no TOA pause and are due to redistribution of heat into the deeper ocean. No-one has done a comprehensive study looking at different types of pause that I’ve seen across models – but I suspect the same is true, i.e. there will be a diversity of pause types.
Thanks,
Ed.
Thanks for the reply!
It would be good to redo with 15-year slowdown rather than pause, as a slowdown is closer to the actual situation. Fully interpolated SAT shows trend ~0.1 C/decade, which also is exactly halfway between pause and expected 0.2C warming rate.
Hi DeepClimate – the 0.1K/decade graphic has been added!
Ed.