Imagine it is 2031, and the IPCC is preparing to release its 8th Assessment Report. How does the recent slowdown in global mean surface temperature rise look? As this largely depends on how fast the climate warms from 2014 onwards, we can explore a range of possibilities.
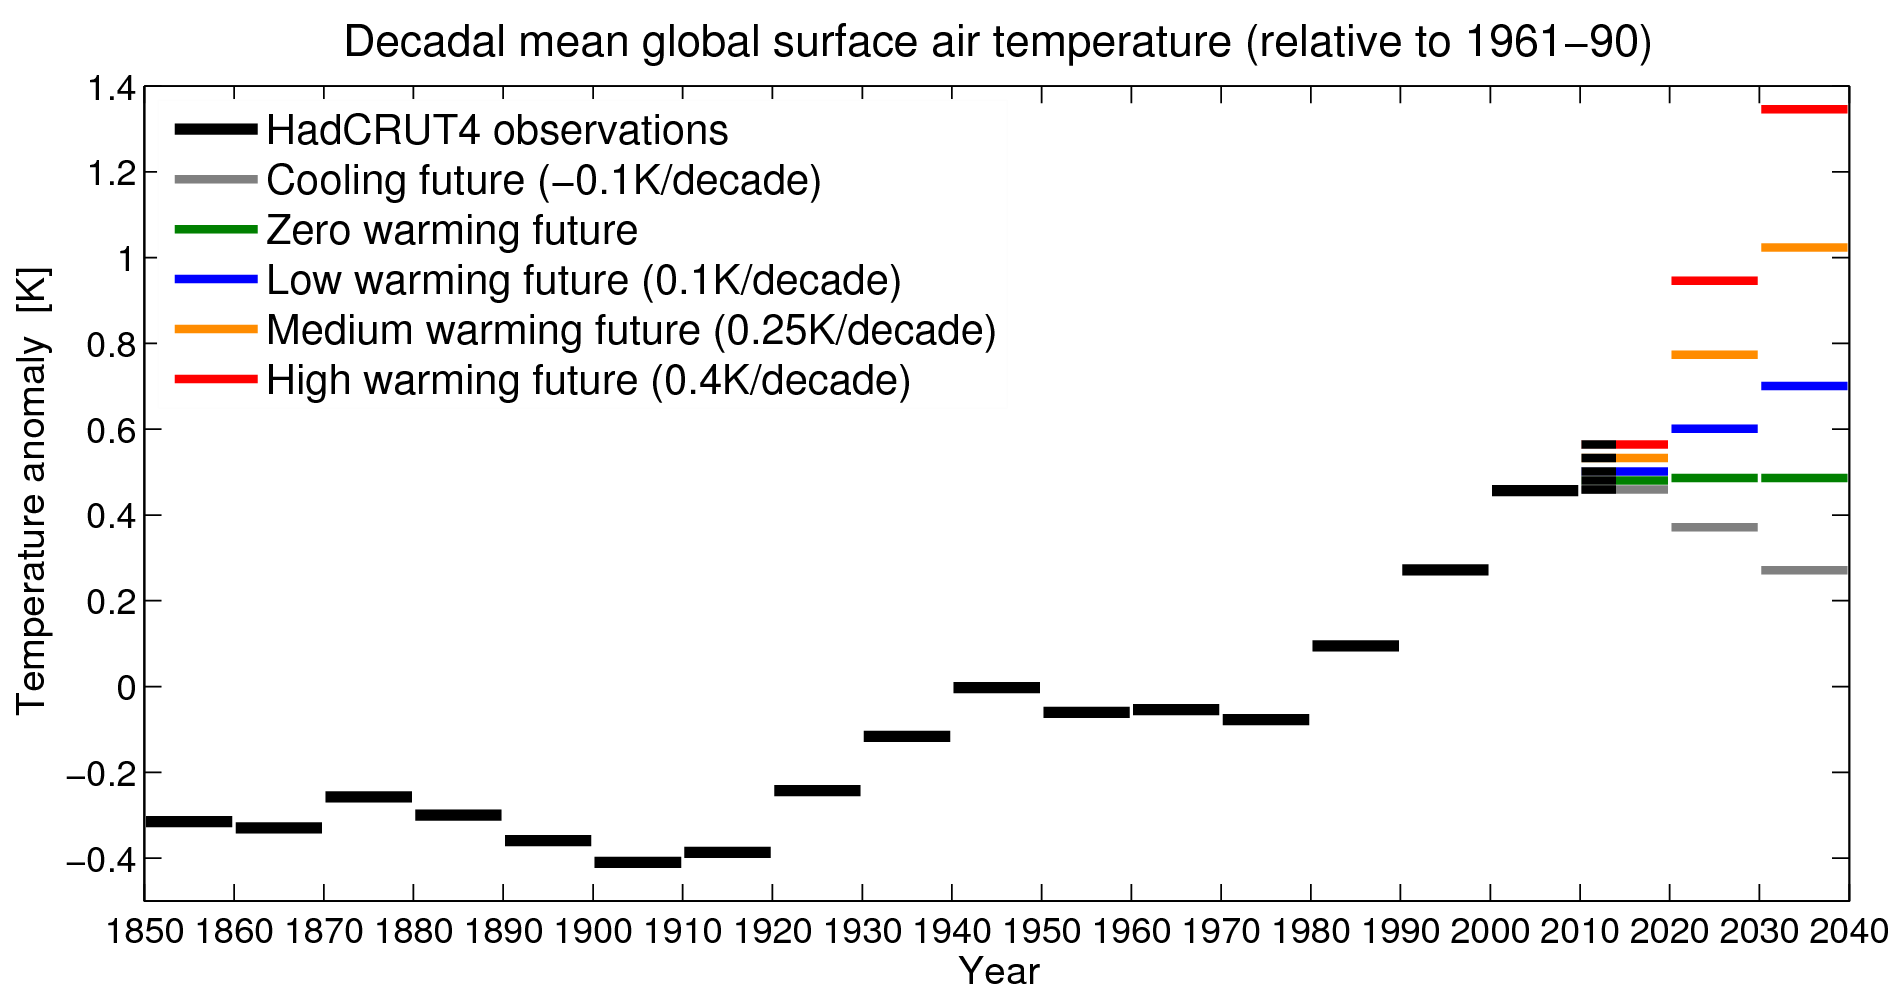
One rather specific example is to consider how a figure showing decadal averages of global temperature (like IPCC AR5 Fig. 1a) might look.
A range of future possibilities are shown for post-2013, including a cooling (grey), no change (green), and warming rates of +0.1K/decade (blue), +0.25K/decade (orange) and +0.4K/decade (red). The IPCC AR5 likely (>66% probability) assessment for global temperatures until 2035 is roughly equivalent to a range of +0.1 to +0.4K/decade.
Whatever warming rate we see in future, there will be a ‘kink’ in this decadal averages example due to the slowdown. So, we may continue to see that the most recent decade is the warmest since 1850, but that does not necessarily mean there has not been a temporary slowdown, as some have appeared to suggest.
But, the key question is: will there be a subsequent global temperature ‘surge’?
Thanks to wildstar gold who suggested making this figure, and to John Kennedy for useful discussions. In the comments, Barry Woods suggested adding the cooling lines.
And if we get a trend for the next 20 years as observed between 1940’s and 1970’s
ie this decade and next are the second, then third warmest on record?
Julia slingo was suggesting this type of possibility, ie a ‘pause’ for 30 years, due to PDO (and other internal variability)
is a -0.1C per decade completely ruled out ( this is even in the range of most current Met Office decadal forecast (+0.28C anomaly)
Thanks Barry – have added a 0.1K/decade cooling for you. But, I don’t think Julia Slingo was suggesting an absolute cooling.
cheers,
Ed.
Hi Ed.
how does this decade look, with the current Met Office decadal forecast, bottom of it’s range, (+0.28C anomaly)
http://www.metoffice.gov.uk/research/climate/seasonal-to-decadal/long-range/decadal-fc
My version of what the graph might look like.
don’t give the IPCC ideas! 😉
I appreciate your work here with the model above. Now I no longer look so stupid when I say that the temperature can both be flat, rise slightly and not only rise extreme.
Regards Jonny
Hello, got the Cowtan & Way dataset, and started fooling around the presumed 70-year cycle. It looks like one has to take some running or smoothed 15-year averages in order for it to appear clearly to the naked eye. Taking some further wild assumptions while still imagining the response to Greenhouse Gases being in there but greatly reduced to what the science says… , produced a graph where 2 deg over preindustrial gets passed only in 2126. The so called ‘hiatus’ is also greatly expanded (to mid 2040s). This is for sure ridiculous, but now I think I see why some people want the sensitivity to be low, even against paleoclimate evidence.
Sorry, reading my own graph wrong, happens all the time… 2114.
please, look at the table AII.7.5 in the annex II WG1AR5_ALL_FINAL:
lower tendency at 0,1°C by decennie is not envisaged in the near future for all RCP (5 %-95 %)
Hi gpiton – please see Section 11.3.6.3 which is the official IPCC AR5 assessment for global mean surface temperature in the near-term (up to 2035). This assessment, which I helped write, takes into account multiple lines of evidence. Annex II is the raw model data only. Fig. 11.25 shows the official assessment compared to the raw model data, and is also described here.
cheers,
Ed.
That’s rather depressing. If we add a little uncertainty to those lines then by 2020 it looks unlikely that one would be able to distinguish any of those possible future scenarios from another. I don’t think I can wait 16 years for this to be resolved.
Almost as depressing as imagining the 8th IPCC report in 2031.
There’s a nice pattern there in those lines. Once the temperature change gets going on a particular warming/cooling rate it seems to stick with that rate until the sign changes and then it goes off on another rate but holds that rate for several decades again until another change.
e.g. 1870-1900’s the decadal temperature drops are quite even for 4 decades, change of direction to a warming world and then until the 1940’s the mean decadal temp increases at similar rate for 4 decades. The next period is flat/cooling (1950’s and 1960’s) and spoils the pattern but 1970’s through to 2000’s there is again 4 decadal increases of similar sizes.
I’m sure that’s just my eye seeing pretty patterns …….. or is it?
As far as I know, the multidecadal oscillation still lacks a good model for the mechanism but it’s somewhat interesting, though. It would be interesting to check if it was present during preindustrial times but I don’t know of proxy temperature datasets with high enough resolution, possibly there are some, but I just haven’t looked.
Thank you for the link of paragraph 1.3.6.3
Climate change is independent of decadal periods in our calendar, it is possible to compare 10-years periods as 2004-2013, 1994-2003, 1984-1993, etc.
The slowdown during the last decade is very visible.
Why this very wide range of future possibilities of warning rates : +0.1°C to +0.4°C/decade (even more if you add -0.1°C/decade) ?
The physical processes that act are not all known ? and/or the influence of some is to clarify? and/or it’s not possible to predict their precise influence on 20 or 30 years ?
The chapter 11 of IPCC AR5 treats these questions.
On the graph, it’s instructive to look at the gap between the decadal periods.
In the périod with no real influence of WMGHG anthropogenic, it varies between -0.14°C and +0.17°C. In the last 4 decades, it varies between +0.07°C and +0.24°C. The trend on the past 30 years is +0.17°C/decade.
This raises the key question concerning the predictions, especially for 0.4°C/decade :
What physical process (radiative forcings + feedbacks) could lead quickly to a gap of 0.4°C between 2 decades, while it has not ever achieved 0.25°C in the past, even recent?
Some assumptions are evoked in Chapter 11 and in box 9.2, but they are very general.
What physical process, except a strong volcanic eruption, could lead quickly to a gap of -0.1°C between 2 decades (not discussed in Chapter 11)?
Hi gpiton,
The IPCC AR5 range of +0.1-0.4C per decade is partly due to uncertainties in climate sensitivity, and partly due to uncertainties in radiative forcings. For example, if the currently negative aerosol forcing is reduced quickly then this would cause extra warming. We might also see a positive contribution from internal variability to push up a short-term trend. The -0.1C/decade is just an illustrative example – it is not an IPCC projection. A strong volcanic eruption is the only likely option for this.
cheers,
Ed.
Ed,
You say
“Whatever warming rate we see in future, there will be a ‘kink’ in this decadal averages example due to the slowdown. So, we may continue to see that the most recent decade is the warmest since 1850, but that does not necessarily mean there has not been a temporary slowdown”
But filtering according to El Nino / Neutral / La Nina seems to show no slowdown as reported here for example http://rabett.blogspot.ie/2014/02/is-message-getting-through.html
Please can you explain the difference? Does the modelling you describe filter in the same way or can it?
Hi Paul,
This example shows the actual temperatures (as plotted by the IPCC AR5 WG1 in Figure 1 of the SPM), rather than filtered to remove ENSO variability, so there is not necessarily any discrepency.
cheers,
Ed.
Thanks, Ed. In other words, there has not in fact been any ‘slowdown’ in surface temperatures once ENSO variability is considered? Isn’t this a point that needs stressing?
As most of the climate system heat capacity is in the ocean, which continues to warm rapidly according to the recent NOAA data, isn’t the concentration here on atmospheric temperature, measuring the warming in a small part of the climate system, a rather a poor basis on which to assert there has or has not been a temporary slowdown in warming?
You say:
“that does not necessarily mean there has not been a temporary slowdown, as some have suggested.”
Given the PDO phase and other natural and human possible cooling forcings it just surely just as true to say:
“this does not necessarily mean that there HAS been a temporary slowdown, as some have suggested.”
In which case why say it at all! Given the brackets placed in Pachauri’s reported comment, it may well be that he was referring to overall climate system warming and not specifically to global mean surface temperature, certainly that would be a reasonable interpretation of the overall comment he makes up to that point. A kink in the surface temperature trend does not necessarily imply any kink in the system trend.
I appreciate the good point you make that there will be a kink in GMST decadal averages but as ever the caveats on the limits on what this means for global climate system warming do need to be made clear, especially to the one-sided optimism of some of your readers.
Thanks Paul,
Some comments:
1) The global surface temperature record is iconic and has been the primary evidence used to demonstrate that the planet has warmed over the past 150 years. We should not play down the significance of understanding its fluctuations.
2) It seems very likely that Pacific variability is playing a key role in producing the observed slowdown. But ‘correcting’ for that is non-trivial, and relies on various assumptions. And, we need to understand the Pacific variability itself too!
3) The ocean (down to ~2000m) has indeed continued to warm, and you are right to say that the whole system is still gaining energy as expected, but the records only go back ~50 years and we don’t (yet) have good full-depth observations.
4) There has been a measured slowdown in surface warming. Understanding the reasons for that is a real opportunity to demonstrate the process of climate science in action to explain an unusual, but not totally unexpected, event.
5) As for Pachauri’s comment: the second sentence refers to the WMO statement which discussed surface temperatures, so I think it is clear that he was referring to surface temperatures. Many others have also used this ‘warmest decade’ argument, which does not negate the existence of a slowdown and leaves them open to easy criticism by skeptics. However, I have slightly edited the text in the post to say ‘appeared to suggest’.
cheers,
Ed.
Ed, many thanks for your full reply.
You are right that the significance of understanding the GST record fluctuations should not be underplayed and this post is very helpful in showing the outlook from here on. As you say there is so much still to be understood and the Pacific variability is poorly understood. I think that it is good to point that out given the initial responses to the post.
Cheers, Paul
The North Pacific is sort of a dead end for deep currents, so it might just be possible that the predominant mode of ENSO cycle is driven by the changes therein. I’m not saying it is, as the tropics are recieving most of the solar forcing so the Indian-Pacific exchange should be the driver whether we’ll see a Nino or Nina. The process is further complicated by the Agulhas leakage to the Atlantic which may also be in a state of permanent change by the southerly movement of storm tracks. The graph in the link is just assuming that a surface-deep ocean exchange increases at approximately the same rate as the greenhouse forcing and that the PDO (count in AMO) are dominating. The sunken heat would resurface (or rather, prevent the heat sink of the ocean working properly) after the period (60-70 years) on high latitudes causing heat waves near Greenland or Antarctica, and there would be no way to diminish the effects of this. I wouldn’t call that too optimistic (well maybe of thinking the rest of my life). This is just somewhat unscientific speculation which won’t lead to any substantial result so I’d better stop fooling myself and get back to following and reporting the atmospheric and ice anomalies over the northern hemisphere and arctic. the graph itself only repeats the pattern of the last 140 years with ever increasing deviation adjusted to the exponential trendline.