As we reach the end of a likely record breaking year for global temperatures, what might we expect for 2015?
Global average temperature:
The Met Office have released their annual forecast: 0.64°C (95% range: 0.52-0.76°C) above the 1961-1990 average. This prediction is based on a combination of a statistical prediction and a GCM forecast.
An unofficial forecast from Emma Suckling for Climate Lab Book, based on an empirical model under development in the EU SPECS project: 0.63°C (95% range: 0.45-0.82°C) above the 1961-1990 average.
Both of these central estimates would make 2015 the warmest year on record, partly due to anthropogenic influences, and partly because of the ongoing weak El Nino event.
Central England Temperature:
2014 has been a record year for temperature for most of Europe, with Central England very likely experiencing its warmest year since records began in 1659 – close to 1.5°C above the 1961-1990 average. However, observations from the University of Reading field site suggests that 2014 will be the second warmest on record for Reading, slightly cooler than 2006.
The weather in the UK has been favourable for warmer conditions in 2014, so I expect 2015 is more likely to be cooler than 2014, although still very likely above the 1961-1990 average.
Arctic sea-ice:
In previous years Climate Lab Book has discussed Arctic sea-ice for the year ahead. In 2012, the forecast was for a recovery from the record minimum that year, which turned out to be correct. In 2013, the forecast was for a lower (but similar) extent the following year, which was also correct.
What about 2015? I think a lower extent than 2014 is slightly more likely, but as usual, the spring and summer weather will play the dominant role in determining how much ice melts.
Anyone else want to make a prediction?
On CET I agree that 2015 is likely to be cooler than 2014 which despite being warmest on record is notable also for a lack of extremes, it has been uni-formally warmer on a monthly basis, bar Aug, Dec will probably end up average given today’s ECMWF ensemble 360 hours. Can’t link it would break license terms.
If we assume the AMO went positive circa 1995 are we approaching a flip to negative which could be quite rapid? The current JAMSTEC
http://www.jamstec.go.jp/frsgc/research/d1/iod/sintex_f1_forecast.html.en
has cool look to the North Atlantic.
IF this was the case would Arctic sea ice show a tentative recovery process, or would anthropogenic factors overwhelm any internally driven variability?
Hi Stephen,
Yes, CET has been warm all year.
There are other studies which also suggest the AMO might be about to change sign:
Robson et al.: http://www.nature.com/ngeo/journal/v7/n1/full/ngeo2050.html
Hermanson et al.: http://onlinelibrary.wiley.com/doi/10.1002/2014GL060420/abstract
and this might have a cooling influence on UK temperatures.
As for Arctic sea-ice, if Day et al. are right (http://iopscience.iop.org/1748-9326/7/3/034011), then any AMO change might have a stabilising influence. More on this topic of Arctic variability will appear early in the new year…
cheers,
Ed.
Ed: A few days ago there was an update here: http://www.rapid.ac.uk/rapidmoc/ with data to March 2014. So we have a 10 years long observation and a statistical significant decline of the AMOC during this time ( yearly data show a trend of -0.43+-0.29 Sv/a). In 2004 the trend started at about 19Sv and now it’s at about 15Sv. So the question of Robson et.al. is answered? The Overturning IS in decline?!
Frank, so if the AMOC is declining are we about to see a negative AMO anytime soon? Sorry for asking the obvious but AMOC metrics are not my strong point having just used accessible AMO/CET data sets, to date. Thanks.
Stephen, the “AMO” ( nothing else than the detrended SST 0…60N; 80W…0W or something like this: The SST of this area – SST 60S…60N) is not a very good metric due to “artificial” eliminating of the longtime forcing. Anyway, we see indeed a declining of the AMO since 2005 ( http://www.woodfortrees.org/graph/esrl-amo/from:2005/from/plot/esrl-amo/from:2005/trend )It very much depends on the MOC, which is an internal variability of the climate of the NH. The direct observation with “Rapid” is too short, anyway there is some kind of proxy: The SST of the subpolare gyre (SPG), see: http://link.springer.com/article/10.1007%2Fs00382-014-2443-7 . There is a poster of this paper online: http://climatemodeling.science.energy.gov/sites/default/files/presentations/DOE_2014_POSTER_Dipole_MUIR.pptx . “The AMOC explains 70% of the variace ot the SST (of the SPG)”. If one uses only the month with a deep mixed layer ( DJFMA, see http://onlinelibrary.wiley.com/doi/10.1029/2004JC002378/pdf Fig.5) there is very, very much AMOC in the SST of the spg, more than 80%. The data since 1880 have no trend at all, so perhaps there is no forcing, almost all is internal varibility, just MOC.
Hi Frank,
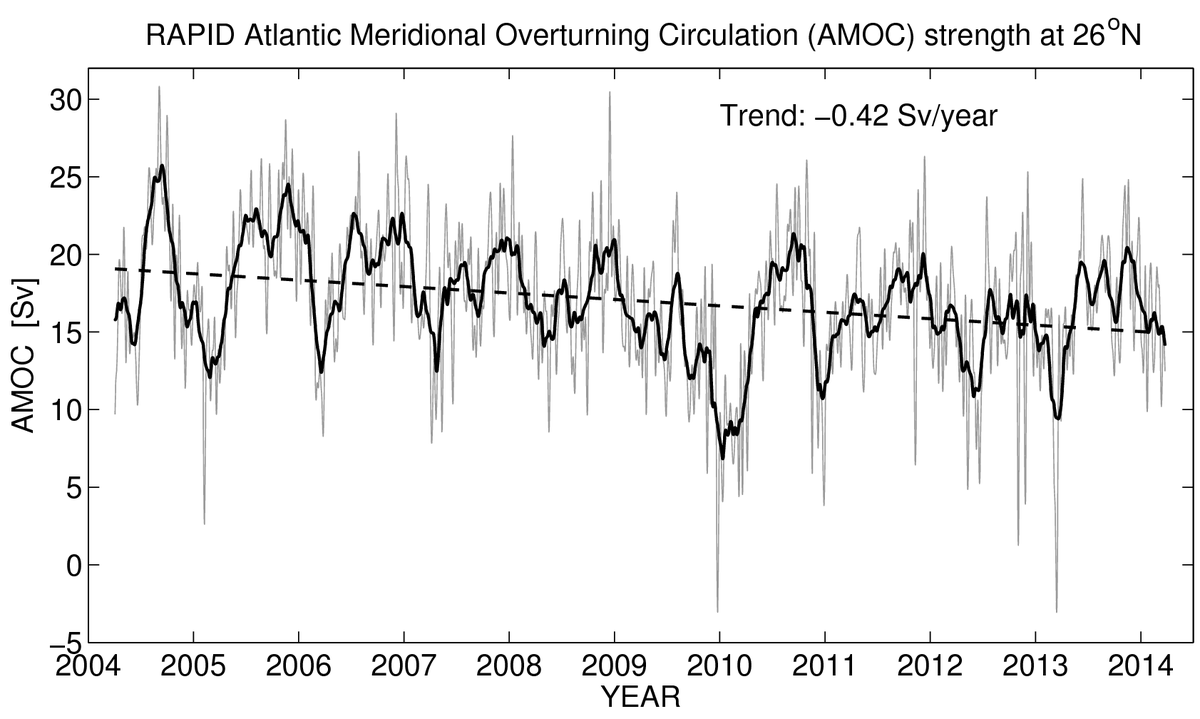
I posted the RAPID data time series to twitter a few days ago:
Most of this data was included in Robson et al., which suggested a further decline was possible.
And this does not necessarily address the cause/s of the decline – whether it be forced or internal climate variability.
cheers,
Ed.
Hi Ed, thanks for your kindly response… Of course the causes of theAMO- decline could be forcing and/or nat. var. . Anyway, the forcing-dependend ( GHG) decline should be now much smaller (according to CMIP5) than observed. So do you agree that in the decline of 2004-now could be enclosed very much nat.var.?
Still another question: I read your paper of 2011: http://onlinelibrary.wiley.com/doi/10.1029/2011GL047208/full and the figure 1a: The triggerpoint for “switch off” of the AMOC is there: 16Sv as observed in the beginning of 2014. Do you suspect that the AMOC could collaps if the decrease goes on?
best
Frank
Hi Frank,
There are papers suggesting that the current observed decline is not outside a plausible range of natural variability, e.g.
Roberts et al.: http://onlinelibrary.wiley.com/doi/10.1002/2014GL059473/abstract
As for the AMOC collapse trigger – the more relevant quantity is the freshwater input at which the collapse occurs, which is at much higher values than seen today.
cheers,
Ed.
Hi Ed, what do you think about http://www.nature.com/nclimate/journal/vaop/ncurrent/full/nclimate2554.html ? They make this operation: AMOC indec= SST sgg – Temp nh . For Tnh they use the data from here http://www.pnas.org/content/105/36/13252.full.pdf%29. ( MM 08). The SST of SPG have no trend since 1930… and voila: We have an AMOC just like a downward HS!! http://www.scilogs.de/klimalounge/files/Rahmstorf_2015_3b.jpg .
Hi Frank,
Here is the SST index from the sub polar gyre as estimated from HadSST3:
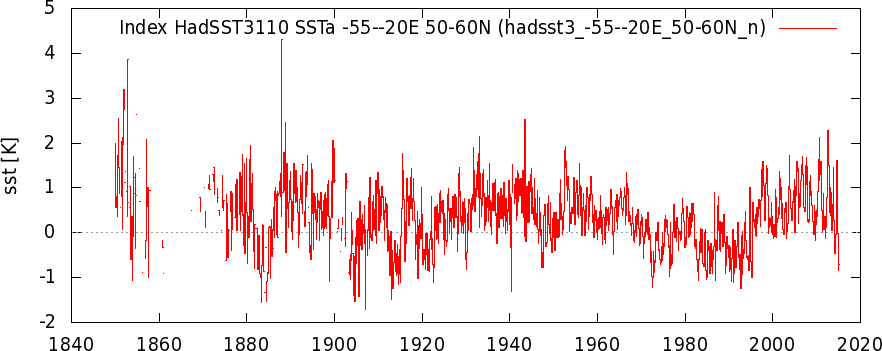
The Rahmstorf paper essentially attributes the overall lack of warming in this region, when compared to the northern hemisphere, to a slowdown in the AMOC. There is also interesting multi-decadal variability, which is often linked to AMOC changes. I need to read the paper more carefully to understand the arguments, especially about this being linked to Greenland melt.
cheers,
Ed.
Thanks Frank.
Hi Stephen,
I’m interested in speaking to Emma Suckling working on SPECS – can you please make an introduction?
The empirical model I’ve been developing uses open data – and I’ll soon be looking into Copernicus multi-model seasonal forecast data to enhance it. At present I’m combining Met Offfice GloSea5 PWS global outputs (and NOAA CFSv2 for summer rainfall) with an empirical downscaling system.
The 1961-1990 temperature anomalies downscaled to UK Met stations for autumn (issued last month) and winter (issued today) can complete the CET record.
http://www.weatherlogistics.com/ForecastArchive_Beta/Autumn20152-4mthForecastEnhanced.csv
http://www.weatherlogistics.com/ForecastArchive_Beta/Winter20164-6mthForecastEnhanced.csv
I’ve verified the forecasts only with 6 seasons so far – as this is all the seasonal hindcast data I have access to. Winter is the only season with convincing skill.
Manchester University Mathematics Department placed a MSc project working to develop an improved statistical model, which has revealed some better methods I am yet to explore.
I hope Emma or yourself can shed some further light on fruitful statistical methods.
Best regards,
Chris
Hi Chris, Think there is a bit of confusion here. Ed Hawkins is “your man” in this enquiry , not me 🙂
Yes, sorry – I had the name Stephen on the mind from your first blog response. I meant to address Ed.
I’ve developed a forecast system using numerical weather forecast data – about 50’000 lines of software. Initially I looked into the impact of the Atlantic Jet stream in detail from ECMWF ERA data, but I’m yet to make full use this data in the model.
Artificial Intelligence systems are up next!
I predict 2015 will be warmer than 2014 because of the weak El Nino.
If the El Nino becomes stronger than expected, then I am predicting 2015 will be very much warmer due to all the warm water in the Pacific at present.
I predict 2015 will be very slightly warmer globally than 2014, but the CET will be significantly lower. I also predict a strong la Nina developing late in the year which will drive global temperatures down in 2016 and 2017, together with a flipping of the AMO. At the same time, the solar sunspot count will be steeply declining. The consequence is that the global highs of 2014 and 2015 will not be repeated for at least a decade. Arctic ice will stabilise for a similar period. All this will drive pause mania and also traffic to WUWT, Climate Lab Book, Bishop Hill and Climate Etc to new peaks. Meanwhile, despite the refusal of India, China, the US, Australia and Russia to agree to new legally binding emissions targets at the UNFCCC conference in Paris in 2015, the EU and UK (if the UK continues to exist – an independent England would be a different matter) will unilaterally pursue the targets of the various EU directives and the Climate Change Act. The consequence will be economically ruinous, and eventually, following the great Sceptic Insurgency led by Viscount Ridley, the closure of the University of Reading some time around 2024. Happy Christmas to you Ed, and to all your readers 😉
David,A robust Xmas comment methinks. However, hopefully science will continue without pause, or even hiatus, and we will end up with better models that allow the initialization of the oceanic variables into the mix , higher regional “definition” etc and importantly more pragmatic usefulness to all sectors that that manage supply chains or allocate resources. My Xmas glass is half full on this 🙂
Thanks David!
Ed.
I predict journalists will stop making up stories about emergency meetings of the IPCC, and then deleting them surreptitiously from their websites.
Well, I did think that until I read David Rose above.
Now I think that sort of thing will continue in 2015, and that is my climate prediction.
If the recent trend for lower ice export thru Fram Strait continue then a continued recovery ( in volume). There seems to have been a lot of science highlighting the abnormally high levels of export thru the 2000’s and the return to more normal export in the past few years.
Happy new year. 2014 was indeed a record warm CET. As seasonal forecasting is relevant to my “day job” I’ve just been looking at some climate indices from NOAA, the NAO was positive for most(7) months in 2014 only Aug significantly -ve. At present Jan has a strongly +ve look (NAO)with a strong jet stream(200hPa) mostly overhead the UK. Stormy weather ensues. Any one wish to point me to any research in this area? Thanks.
Stephen
Took a quick look at all the 2-4 month forecasts I produced for 2014. UK average temperature is +0.72C above 1961-1990 average, with natural variability nearly cancelling out over 4 seasons.
Statistically speaking 2015 should be similar, unless there is some major feature. North Atlantic sea temperatures exerted a 0.5 to 1.0C cooling e.g. 1998 to 2008 period, which in the long term cannot be ruled out.
*apologies. I mean exerted a warming effect.
My attribution data is presented here:
http://www.weatherlogistics.com/?page_id=505
For those enjoying predictions here is the new JAMSTEC look how cold the N Atlantic is!
http://www.jamstec.go.jp/frsgc/research/d1/iod/sintex_f1_forecast.html.en
Steven, Ed: Have you seen the latest ( until 12/14) data of Heatcontent 700m of the subpolare Gyre?
http://climexp.knmi.nl/data/inodc_heat700_-50–20E_45-60N_na.png
and the extratropic northern Atlantic Ocean:
http://climexp.knmi.nl/data/inodc_heat700_-60-0E_30-65N_na.png ?
Do we see a relativly abrupt decline of the AMOC??
Hi Frank – yes, those are some dramatic changes, especially in the sub-polar gyre. I think it looks like a switch to negative AMO is happening. The RAPID data has also shown a slowdown of the AMOC and the deep density in the Labrador Seas is low. The Met Office decadal prediction is also forecasting a further cooling of the sub-polar gyre.
However – at first glance I did wonder whether there are any data problems – the SPG changes are very fast…
cheers,
Ed.
Hi Ed, yes I calculated the year-to-year differences of OHC(700) of SPG (45-60N;50-20W) since 1956 and found that the decline from 2013 to 2014 was a 2.7 sigma event, anyway…the climb from 1995 to 1996 was a 3.4 sigma event. Both values are some kind of outstanding when we think of the thermal inertia of so much water… 1996 means a warming of 0.5 K, 2014 means a cooling of 0.4K of this volume. Very much energy at work…
I’d be interested to know what you think this means not only for UK/Europe but also further north in the arctic. If the gyre is cooling and has less energy to release into the atmosphere will this impact heat avection into the arctic and arctic sea ice?
Hi HR, for sure there should be some infuences from AMO(C) to the arctic, just as Ed said: http://www.climate-lab-book.ac.uk/2015/arctic-erratic-as-expected/#comment-434617 .
For the annual outlook of the coming seaiceextent I use other data: The OHC 65-90 deg.N . See http://www.arcus.org/files/search/sea-ice-outlook/pdf/bosse.pdf for some details (sorry for some enigma-English there 🙂 )
Looks like ENSO neutral could persist into the NH summer. The January 2015 PDO just came in at 2.45, just a slight dip from December’s 2.45. Looks like ocean SSTs are going to remain at record levels, and perhaps set more records. It looks like land areas are going to catch up with the SSTs.
All adds up to the 2014 ENSO neutral heatwave, the J-NG heatwave, continuing for as far as the eye can see, and perhaps even forever!
Hi JCH,
I was a bit puzzled as to “J-NG” is that as in “Texas State Climatologist, John Nielsen-Gammon”? So many acronyms 🙂
Stephen – sorry for late response. Yes, my state climatologist, J-NG wrote an article before 2014 suggesting there could be a record warmest year during an ENSO neutral year – dominated by neutral conditions. I was thinking the same thing, but he put it into words. 2014 was essentially ENSO neutral. As for my prediction this year, it’s looking pretty good. NOAA has both land and ocean #-1 in their record in May. Climate Prediction Center is still neutral. First 5 months of 2015 hottest in record on the crest of the ENSO neutral heatwave.
Thanks JCH ,albeit belatedly, on my part too.Looks like a super El Nino might be on the cards if the latest JAMSTEC has “legs”.
http://www.jamstec.go.jp/frsgc/research/d1/iod/sintex_f1_forecast.html.en
Using the drop down options looks like the globe will set a record high temp, though not for here in the UK one of the very few cool spots!
The big difference though with 97/98 ENSO is the evolving cool AMO. Quite an interesting set up. I’m looking forward to seeing how it pans out, especially at the regional level. Good test for the Jamstec.