Could varying concentrations of atmospheric carbon dioxide cause the planet to warm and cool? This was a key question facing scientists from the mid-1800s onwards – not because of a concern over man-made emissions of CO2, but because of a desire to understand the causes of the ice ages (identified by Louis Agassiz in 1837).
Then, 75 years ago, in February 1938, a little appreciated scientist, Guy Stewart Callendar, presented the first evidence that the planet had recently warmed. Callendar also suggested that changes in atmospheric CO2 had caused a large part of this observed warming. A new paper reanalyses Callendar’s work to mark the 75th anniversary of his landmark study.
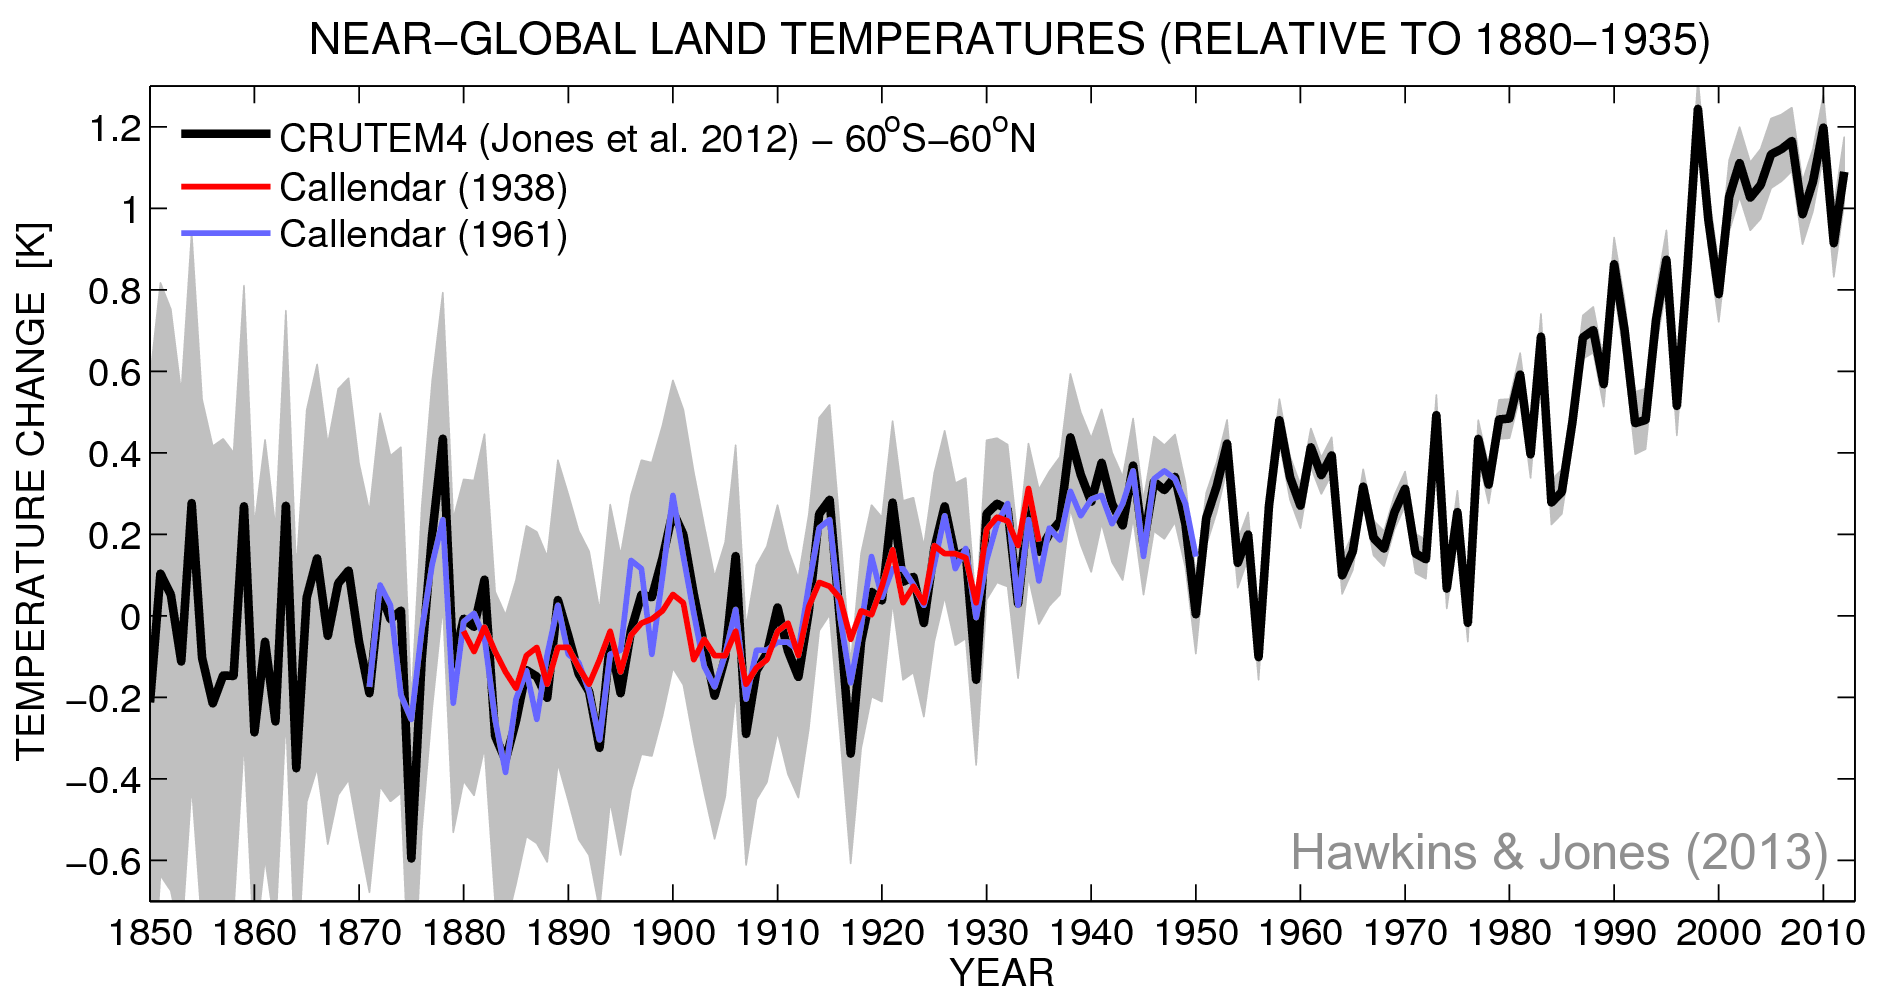
Guy Callendar (1898-1964) was, like his father, a internationally renowned steam engineer by day. But, in his spare time, he was also an avid amateur climatologist. In 1938, he published the first evidence that the planet had recently warmed – by about 0.3°C over the previous 50 years. He did this by collecting temperature readings from 147 weather stations scattered over the planet, and averaging them together to produce an estimate of global temperatures. Callendar had little or no data from the Arctic, Antarctica or over the oceans, so his estimates actually represented the temperature of land regions between 60°S-60°N. But, what is most remarkable is that he did all the calculations by hand, without the aid of a computer.
By 1961 he had collected many more widespread temperature readings, and was able to produce an extended estimate for near-global land temperatures stretching over the period 1870-1950. Fortunately, Callendar tabulated his temperature estimates in his published papers, and these have now been compared with more recent analyses which use data from many more weather stations. The agreement between Callendar’s and the modern estimates (shown in the Figure) is perhaps surprising – Callendar had managed to measure the temperature change of the planet, from his desk, to within the modern estimates of the uncertainties that exist.
John Tyndall had been the first to suggest a role for CO2 in regulating the climate in his pioneering laboratory experiments in the 1860s. These experiments demonstrated that CO2 (and other gases) could effectively absorb infra-red radiation and therefore alter the planet’s temperature. However, many scientific disagreements remained over the role of changes in atmospheric CO2, largely because of uncertainty in many of the measurements (particularly the atmospheric absorption spectrum).
Callendar suggested that about half of the observed temperature increase in the early 1900s was due to the accumulation of CO2 in the atmosphere. Although his estimate used a rather simplistic representation of the atmosphere, it renewed the scientific debate over whether carbon dioxide could regulate the climate and spurred many other scientists to make improved measurements of how infra-red radiation was absorbed in the atmosphere.
However, doubts in the role of CO2 remained, partly because the world did not warm further – in fact land temperatures fell slightly until around 1975, before the warming resumed. This temperature plateau is very likely due to increased levels of particulates (or ‘aerosols’) in the atmosphere reflecting solar radiation back into space. Ironically, these aerosols are also the product of fossil fuel burning and strict regulations were imposed in the developed world on their emissions in the 1960s and 1970s which allowed the warming from carbon dioxide to emerge again. Aerosol emissions from the developing world may also have played a role in the temperature plateau since around 2000.
In the last 75 years, much has been learnt about the atmosphere and the climate system. Although there is still some uncertainty in the exact amount of warming produced by increasing carbon dioxide, the fact that it does warm the planet is now without question, at least partly due to the work of Guy Stewart Callendar. His considerable efforts in performing the tedious calculations required to measure the temperature of the planet should be more loudly acknowledged.
Ed Hawkins & Phil. D. Jones (2013). On increasing global temperatures: 75 years after Callendar, Quarterly Journal of the Royal Meteorological Society, preprint pdf
Callendar, G. (1938). The artificial production of carbon dioxide and its influence on temperature, Quarterly Journal of the Royal Meteorological Society, 64, 223-240, 10.1002/qj.49706427503
Callendar, G. (1961). Temperature fluctuations and trends over the earth, Quarterly Journal of the Royal Meteorological Society, 87, 1-12 10.1002/qj.49708737102
Thanks to Doug McNeall & Gavin Schmidt for useful comments.
or perhaps aerosols and co2 role is overstated.
and other natural processes dominate, multi-decadal oceanic oscillations being just one possibility… against a background rise (0.7C/per decade per century. also natural) ie both in cool phase soon.. should be interesting to observe actual temps for a few years.
time will tell, no doubt..
oops, meant to say 0.07C per decade per century!
at least you said ‘very likely’..
but what thinking/thought processes, etc made this statement of ‘very likely’ possible. not saying it, is wrong, just not proven.
I might say natural factors are very likely, ie, similar 80’90’s rate of warming observed in 1910-40’s and in the 19th century as well and to settle on an AGW explanation, requires a bit more than we haven’t thought of another explanation, or it only worls in models, if we uses CO2.
Given the sheer number of low understanding that even AR5 lists for natural processes, I do not see where the ‘very likely’ comes from.
http://www.ipcc.ch/publications_and_data/ar4/wg1/en/ch2s2-9-1.html
Prof Judith Curry perhaps puts some of this better here:
http://curry.eas.gatech.edu/santafe/papers/santafeattribution.pdf
“Although there is still some uncertainty in the exact amount of warming produced by increasing carbon dioxide, the fact that it does warm the planet is now without question”
Something of a cause and effect problem here I think. The calculations used to determine how much warming is produced by carbon dioxide compared to how much carbon dioxide is produced by warming are naively oversimple.
Someone important has started to see the light though:
Prof Phil Jones – Daily Mail Oct 2012
“… to suppress the warming.” I can’t imagine Jones meant anything other than “to suppress the warming [signal]” below the noisy surface temperature readouts caused by the uncertainties of how much GHG-caused heat is going to heat the air or the ice, the land and the oceans over any given period of time. The oceans alone absorb ~90% of all the heat. The natural variability of the ENSO cycle makes the oceans alternately give up more heat to the surface air (exaggerating the apparent global warming trend, as in the 1990s) or soak up more of it (“suppressing” the trend, as has been the case since ~2000). Foster and Rahmstorf and other scientists (see http://skepticalscience.com/foster-and-rahmstorf-measure-global-warming-signal.html) are beginning to adjust the noisy surface temperature record (especially noisy over short periods, like 15-20 years) by removing the estimated cooling and warming effects of non-anthropogenic radiative forcings. Their results are very instructive and make a compelling case that GHG emissions haven’t suddenly lost their religion. Their light has merely – as it always does from time to time (see for instance http://www.skepticalscience.com/graphics.php?g=47) – been temporarilly buried under a bushel.
One of the most interesting bits of the Callendar paper is the conclusion, which you mention in your paper though not here:
“In conclusion it may be said that the combustion of fossil fuel .. is likely to prove beneficial to mankind in several ways, besides the provision of heat and power. For instance the above mentioned small increases of mean temperature would be important at the northern margin of cultivation, and the growth of favourably situated plants is directly proportional to the carbon dioxide pressure. In any case the return of the deadly glaciers should be delayed indefinitely.”
Of course this view that warm is good and cold is bad was the norm for centuries until global warming hysteria overtook climate science about 20 years ago.
Another nice example of this is the textbook “Atmosphere, Weather and Climate”, by Barry and Chorley, written around 1970. Towards the end it say “Unfortunately the latest evidence suggests that the warm period of the 1920s and 30s has come to an end”.
Hi Paul,
Yes, Callendar suggested some positives of a warming planet – and ones which I also agree on. The higher northern latitudes will be able to go crops they couldn’t before, and an ice age is now less likely. But, there are clear negatives as well – sea level rise, higher risk of extreme heatwaves etc – which he either did not think about, or realise would be detrimental.
cheers,
Ed.
Callendar’s measurements are astonishingly accurate. It makes you think how he selected the weather stations to collect data from … or was it more haphazard, and he just got lucky?
Guess I will have to read the paper.
Hi Toby,
I recommend reading the paper – I think he took all the data he could find, but he states that he didn’t use some of the more northerly stations which showed a larger warming near the Arctic. Interesting to note that not many temperature records are actually needed to reconstruct a good estimate of the global mean.
cheers,
Ed.
The periods of temperature increase from 1910 to 1945 and from 1975 to 2005 were coincident with a rising AMO. The periods of falling temperatures from 1870 to 1910 and from 1945 to 1975 were coincident with a falling AMO. Surely this deserved a mention.