A rather specific question today – what will happen to maize yields in France in 2016-2035?
There are many factors affecting yield (the production per unit area) of a crop such as maize. The main cause of changes in yield is technology development which has increased yield by at least a factor of 3 over the past 50 years – we are just better at growing crops, for a variety of reasons! The weather may also have an influence – crops are known to be sensitive to very hot temperatures, and dry conditions, although precipitation may be less important now due to the increase in irrigation. However, recent trends in yield have been fairly flat, leading to speculation about whether this is due to changes in weather or technology saturation.
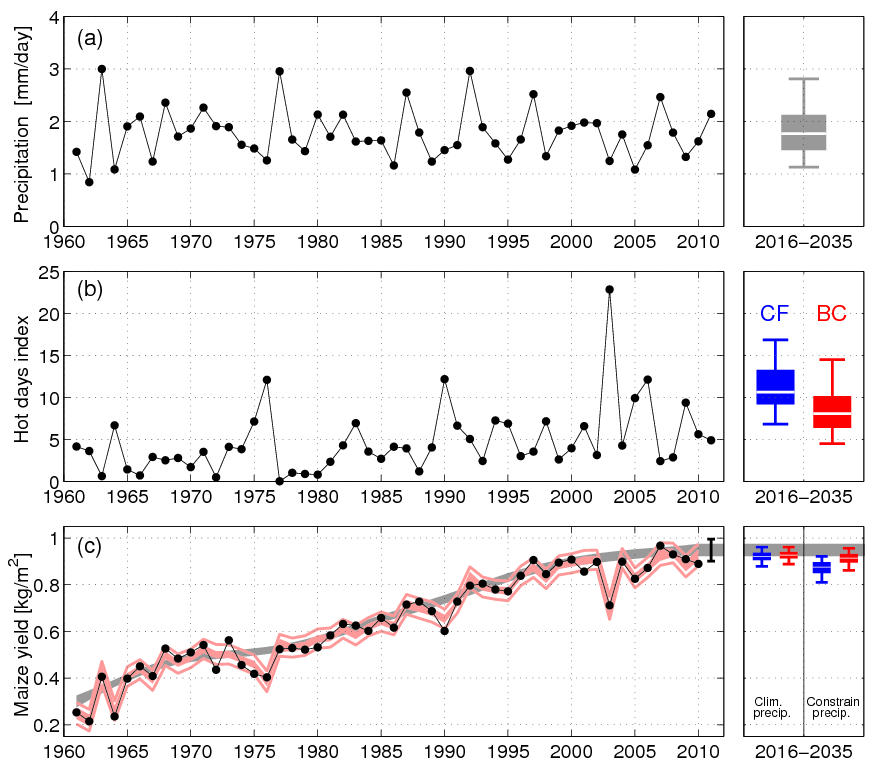
Figure 1 below shows observed changes in summer precipitation and temperature (represented by the number of days with maximum temperatures over 32°C), and maize yield for France since the 1960s. There are a number of years when the yield is relatively low, and these years often correspond to particularly hot years or dry years. The heatwave of 2003 is the most prominent example. An empirical model is constructed (pink shading and lines) which represents the trend due to technology (and this will also include a CO2 fertilisation effect), and the effects of weather on yield. The yield for 2011 has not yet been published, and a forecast, given the known weather, is given by the black error bar.
UPDATE (04/09/13): 2011 forecast was 0.9-1.0 kg/m² (5-95% ranges) assuming no technology development since the previous year. Final FAOSTAT data now available shows an observed yield of 0.99 kg/m², just within our forecast range. The provisional data showed a yield of 1.02 kg/m², but this has been revised downwards. We hope to update the analysis to 2012 and 2013 in due course.
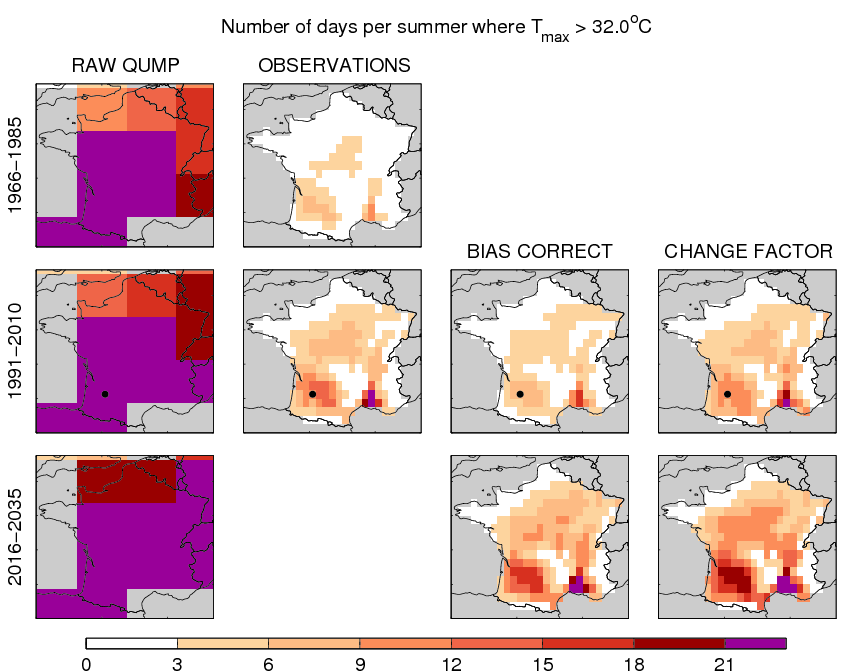
The success of the yield model suggests that the reduction in future yields due to climate can be predicted if the future number of hot days can be projected. Equivalently, this would be the amount of technology development required to negate the effects of climate. This is no easy task, particularly because the climate simulations used here (the QUMP ensemble) are too warm, which means they have too many days over 32°C. Two relatively sophisticated calibration schemes (termed ‘bias correction’ and ‘change factor’) are utilised to remove the biases in both the mean climate and the daily temperature variability and hence correct the projections.
Figure 2 shows how the calibration affects the projected number of hot days, with the raw simulations (left), observations (second column) and calibrations (right columns). The 1991-2010 period is predicted retrospectively using observations from 1966-1985 to perform the calibration as a test of the methodologies – and they work well for predicting the 1991-2010 period. The equivalent projections for 2016-2035 are also shown.
These different projections of hot days can be used with the empirical model of yield, and assuming that precipitation does not change, to produce the yield forecasts shown in the bottom right of Figure 1. There are also choices to be made about future relationships between temperature and precipitation, but the conclusion is that technology developments need to increase yields by 12% to be confident that current yield levels are maintained. The current rate of technology development is not sufficient to meet this target.
This work has been submitted accepted to Global Change Biology.


Hi
I really do not know whether it would be of any interest but white maize is grown in Namibia.
The area under cultivation is small (much of the country is either in the Kalahari or the Namib), about 2% of all land is under crops and only ~12000 hectares under maize. When grown as a commercial crop it is well confined (I believe) to a few small areas. They do keep statistics, and they get a goodly number of >32C days each growing season.
The yields are LOW as one might expect. About 1/4 of the crop is irrigated and they seem to keep separate stats for irrigated/non-irrigated and by area, possibly by processor. There is a complication as they can plant at various times of the year but that may be recorded.
Crop yields are big news in Namibia, literally. They set the cost of living for the year for much of the population.
There is a chance that they have worked out the effect of rainfall and temperatures on local yields. The main university is in Windhoek as are the Government Ministries. They are quite protective of opportunities to do research on all things Namibian.
As an aside, when scientific reports get published that deal with regional climate change there are people on the recieving end for whom it is of more than academic interest. Speculation on decreasing precipitation and increasing desertification needs to be thought long and hard about. I do recall one that produced near term doom and gloom about ~10 years ago. Forcasting increasing droughts in a land that ranges all the way down to hyper-arid (where any significant rain can be an extreme event on the local scale) is seldom wise. Fortunately it took a turn for the wetter but it does from time to time.
Alex
Thanks Alex – we certainly have thoughts about how to extend what we’ve done already to other countries, and perhaps we should add Namibia to the list! Are the local yield stats available online anywhere?
cheers,
Ed.
Hi Ed,
Try searching on the Namibian Agronomic Board wesite as follows:
site:www.nab.com.na white maize
Annual reports give a bit of a breakdown. You may be able to assess the yield variance (which I believe is huge from bumber to disaster). My guess is that underneath the figures are the individual returns either by grower or by processor.
The samples are small as I said, but that might be a good thing, or it might not.
Sadly I doubt that it is worth trying to go back further then independence (1990 as it followed about 20 years of civil war).
Ultimately the data probably belongs to the Ministry. Did I indicate that they can be touchy about foreign interference? I think I did but it is worth restating. They are a new nation and like to be respected.
The national language is English and they are a Commonweath nation.
If you see anything you think worth persuing I suppose the obvious point of contact would be the Namibia Meteorological Service which is part of the Ministry of Works & Transport.
Here are some of their climate statistics:
http://www.meteona.com/attachments/035_Namibia_Long-term_Climate_Statistics_for_Specified_Places%5B1%5D.pdf
Looking at them, it might be not quite as hot in the growing season as I thought. It might be worth checking other sources. Alternatively their problem may be due to the difference between shade temperatures, and field temperatures. Things in direct sunlight, e.g. the sand, can be too hot to hold.
FWIW, they don’t like to eat yellow maize, they associate it with animal feed.
As and idea, Namibian white maize may be something or nothing. But if Southern Europe does warm by 2-4 or more degrees it could be much like Namibia.
Alex