[Updated: 16/01/2020]
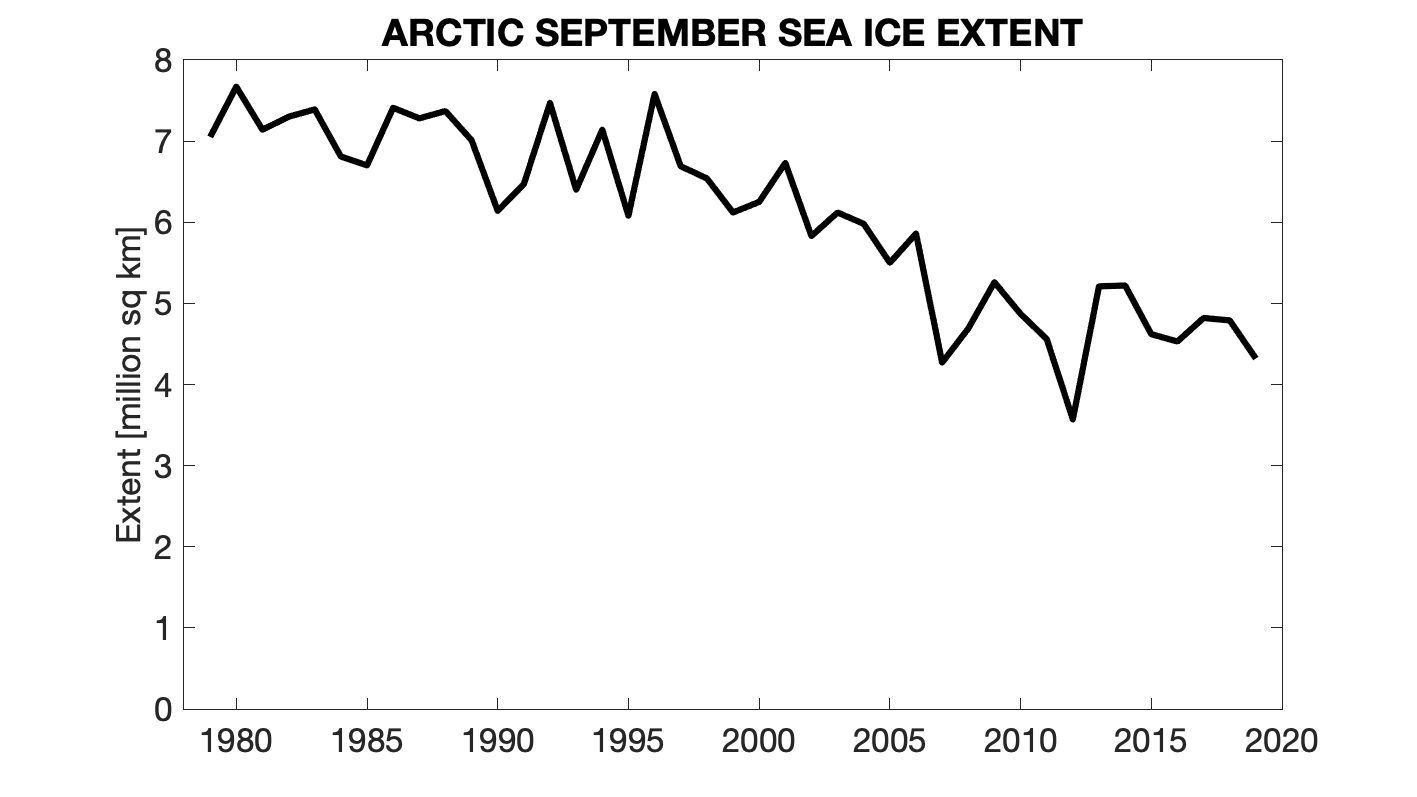
The decline of Arctic sea ice over the past 40 years has been one of the more obvious signs that Earth’s climate is warming, especially in the summer when the ice extent reaches its annual minimum. Here you can watch how the amount of sea ice in the Arctic has varied since the start of the satellite era in late-1978.
Animation for September sea ice concentration:
On top of the long-term downward trend, there are substantial year-to-year variations in the amount of sea ice due to fluctuations in the weather. We do not expect new record low amounts to be seen every year.
[Note that there are gaps in the data near the North Pole, especially because the earlier satellites could not collect data there, but these have been infilled.]
I need your help in understanding something. Please tell me why your recent study with Santer et al, was used as proof of manmade climate change being a hoax? I was told you and 27 other authors of the study wrote a summary stating that there is too much we don’t know to believe in manmade climate change (and global warming). I have been searching for information on this, and only find information on rightwing websites stating that you and other authors accuse Santer and Mann of omitting your opinions on the study’s findings. I’m literally at a point where finding the truth about climate change is getting too complicated to continue. Trying to persuade friends and families (in an area dominated by GOP loyalists) to care about manmade climate change is getting too difficult to keep my passion for it going. Please help.
Thanks Patrick – the ‘fact sheet’ we wrote to accompany the paper, which was made available to journalists, is here:
https://pcmdi.llnl.gov/research/DandA/Synthetic%20Microwave%20Sounding%20Unit%20(MSU)%20temperatures/2017/Nature_Geoscience/NG_Fact_sheet_v3.pdf
Hopefully this answers your queries? Can you send me some examples of the sites you’ve seen where it is said that we accuse Santer & Mann?
Thanks,
Ed.
It’s so alarming I don’t know what are the so called superpowers are doing to control the global warming. It’s also every human’s responsibility not to harm the nature, Thanks for sharing the 3d animated picture to understand the situation more easily.
Thanks for your good work. I appreciate the arctic animation article, but can you find a way for the reader to pause or stop the cycle, so that one can focus on a particular year? I’m trying to study this process more closely (using ‘polar portal’ and other sites), and the rapid switch from year to year makes it much harder for me to make comparisons. Best Wishes, Doug Baty