In new research a volcanic eruption is exploited as a natural laboratory to test how tiny aerosol particles in the atmosphere influence climate through their effect on cloud.
Guest post by Richard Allan
Pollution haze presents a serious health problem for many regions, particularly large cities such as Beijing. Yet small pollutant particles in the atmosphere, or aerosol, also influence our climate through a “parasol effect” which shades the surface from incoming sunlight. Increased aerosol pollution has contributed a cooling influence on climate, without which the planet would have warmed even more than it has done in response to rising greenhouse gas concentrations, also the product of human activities.
Quantifying the size of this cooling effect is a great challenge due to the complex interactions of aerosol particles with sunlight, particularly through indirect effects that make clouds reflect more sunlight back to space. Understanding and reproducing the correct aerosol-cloud effects in simulations is crucial for our ability to project future climate change as well as interpreting historical warming of climate.
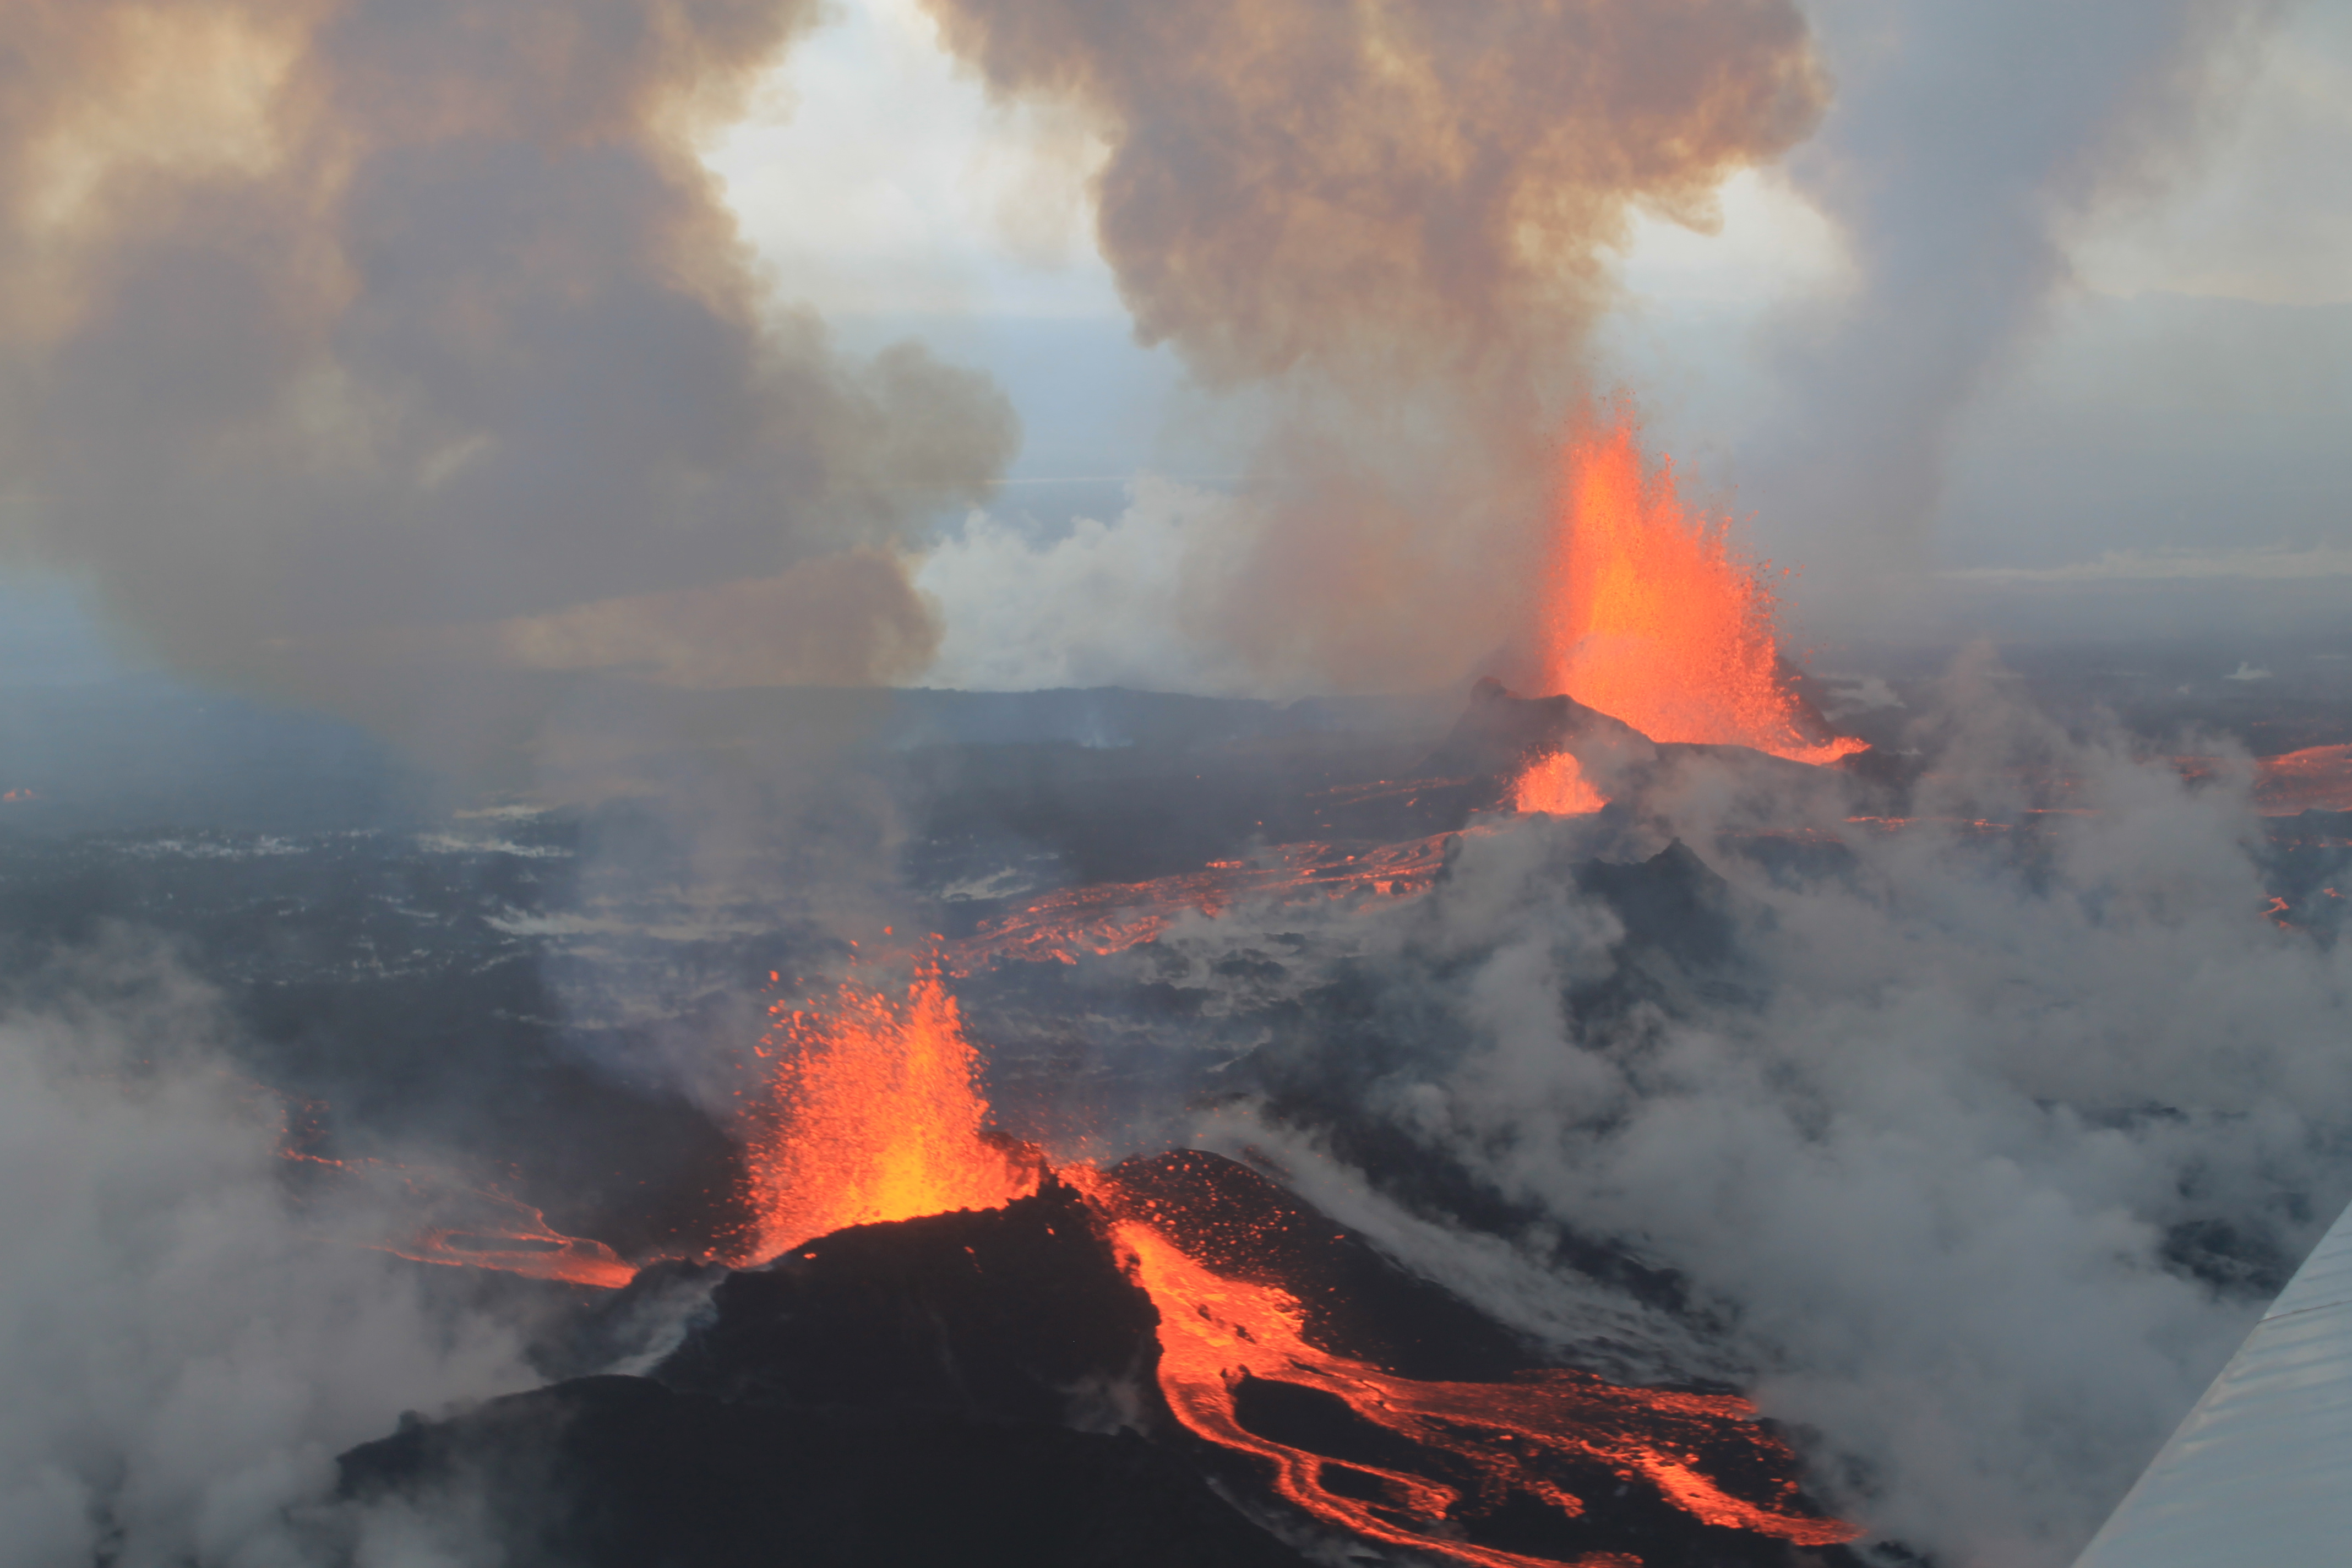
In our study we use a novel approach to tackle the challenge of how aerosol cools climate. In September and October 2014 a massive volcanic fissure eruption in Holuhraun, Iceland (Figure 1) continually injected vast quantities of sulfur dioxide into the atmosphere at rates exceeding European industrial emissions. It effectively mimicked a sulfate aerosol pollution haze, being an ideal natural experiment to test simulations of the cloud-aerosol effects on climate.
Satellite measurements covering the aerosol haze could identify a large region of smaller, more numerous cloud droplets (Figure 2, top). We also demonstrated that the UK Met Office Hadley Centre climate model (HadGEM3) was able to capture this effect, building confidence in understanding of aerosol interaction with cloud. However, further anticipated modifications in cloud properties such as the quantity of cloud water were not detectable above the month to month fluctuations in weather patterns (Figure 2, bottom).

Our findings are important since some climate models built by different teams of scientists and considered in the study produce a strong additional cooling effect from aerosol influences on cloud characteristics such as cloud water and longevity. Discounting simulations that producing unrealistically strong aerosol cooling effects offers a potential route for improving confidence in climate change projections.
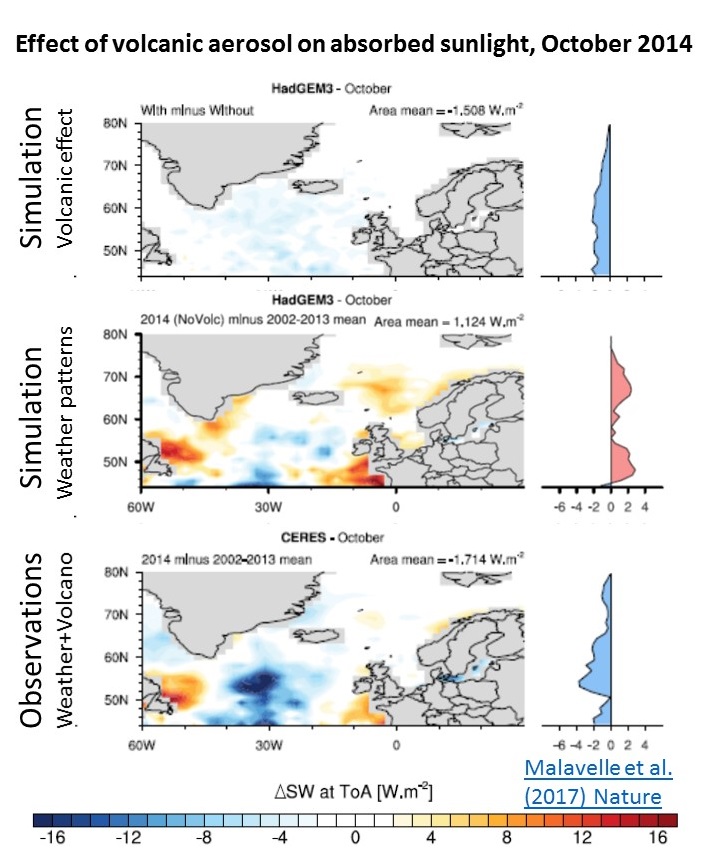
There are a number of challenges to overcome in constraining the cloud-aerosol effect on climate. One limitation of the current analysis is that the expected aerosol cloud brightening signal is difficult to discern above the substantial month to month fluctuations in weather patterns when considering satellite data measuring the total sunlight reflected from the planet (Figure 3):
A further caveat is that the findings primarily apply for sulfate aerosol interaction with low altitude clouds in the North Atlantic. How generally the results apply globally to contrasting cloud and aerosol types is questionable. Preliminary analysis suggests similar effects were apparent for a contrasting case at Mount Kilauea, Hawaii during 2008 and for idealised simulations in which the volcano was transported to other regions of the globe and even back in time! Yet uncertainties in the satellite observations and the representation of fine detail depicted by the simulations plus the reliability of their input variables further confound understanding. Nevertheless, the results present tantalising evidence that the cloud-aerosol effect on climate is smaller than previously thought.
For further details, please see our publication (available from the authors):
Malavelle et al. (2017), Strong constraints on aerosol-cloud interactions from volcanic eruptions, Nature, 546, 485-491, doi:10.1038/nature22974.
If “the cloud-aerosol effect on climate is smaller than previously thought” then to reproduce the temps seen in the past such as the mid-century cooling, weaker forcing by carbon dioxide is needed. This, I think, would lead one toward a lower climate sensitivity.
Good point Robert. I think the applicability of the results to aerosol-cloud interactions globally remains to be proven but there are a number of studies suggesting aerosol radiative forcing is more likely to be at the lower end of the considerable uncertainty range which if true may imply that the highest climate sensitivity values are less likely. Oh, I should mention I’m just recovering from a general anaesthetic after a minor op in case I say anything daft!
Is that necessarily the case? If mid-century cooling was caused by the PDO, as an example, then couldn’t that mean the climate is at least as sensitive to CO2 as the consensus currently thinks, and perhaps even more sensitive?
True! Understanding what’s aerosol forced or unforced variability in the historical record is problematic particularly the long time scale internal variability of which understanding is low and which climate models may struggle to represent.
Well, I do not think they struggle with it in any significant way. They appear to be unable to do timing now, and probably never will be able to do it, but the averaging it out appears to be a serviceable solution. Shell still hits the target. I think this quote by Kyle Swanson of Tsonis and Swanson puts it nicely: A climate that is highly sensitive to radiative forcing (i.e., responds very strongly to increasing greenhouse gas forcing) by definition will be unable to quickly dissipate global mean temperature anomalies arising from either purely natural dynamical processes or stochastic radiative forcing, and hence will have significant internal variability. The opposite also holds. It’s painfully easy to paint oneself logically into a corner by arguing that either (i) vigorous natural variability caused 20th century climate change, but the climate is insensitive to radiative forcing by greenhouse gases; or (ii) the climate is very sensitive to greenhouse gases, but we still are able to attribute details of inter-decadal wiggles in the global mean temperature to a specific forcing cause. Of course, both could be wrong if the climate is not behaving as a linear forced (stochastic + GHG) system. So when the Eastern Pacific, a vast area of the surface, stopped being ice cold in 2014, one would expect a rapid rebound in the GMST because the systems very sensitive to ~400 ppm. Bam.
Interesting paper. The part which leaves me a little confused is why an undetectable LWP effect is interpreted as indicating smaller than expected aerosol-cloud radiative forcing. Unless I’m misreading Figure S5.2C, it shows that LWP response to the volcanic perturbation is also undetectable in the HadGEM3-UKCA model used. It looks like the CAM5 model responses shown in Figure S8.1 tend to significantly overpredict LWP response North of 65º latitude, but not HadGEM3-UKCA.
As far as I’m aware, HadGEM3 aerosol-cloud forcing is towards the most negative end of the AR5 uncertainty range, and appears to be consistent with observations discussed here. Are the authors suggesting that HadGEM3 aerosol-cloud forcing is shown to be too strong, and if so based on what?
Also, regarding the cloud-aerosol effect being smaller than previously thought, could the authors be specific about what they believe was previously thought? There seems to be such a wide range of starting points/Bayesian priors for what aerosol forcing is believed to be that any result could really be both smaller and larger than previously thought, depending on perspective.
“Are the authors suggesting that HadGEM3 aerosol-cloud forcing is shown to be too strong, and if so based on what?”
I’m not one of the authors, but I did come across a presentation by Zhang several years ago.
http://www.tims.ntu.edu.tw/download/talk/20120917_2282.pdf
He was looking at the AMOC and HadGEM2-ES. HadGEM closed modeled North Atlantic temps over the 20th century, primarily driven by aerosol indirect effects.
Zhang writes:
“The HadGEM2-ES simulations show no trend in North Atlantic upper ocean heat content, in contrast to the substantial warming trend seen in observations. The discrepancy is mainly due to anthropogenic aerosols and suggests that aerosol effects are strongly overestimated in HadGEM2-ES.”
Yeah, I’ve read that paper (I think our host has some colleagues who were co-authors), and it’s a completely different type of analysis which doesn’t have any bearing on the paper under current discussion.
In any case that conclusion doesn’t really check out for me, at least if you interpret it to mean that what they found suggests aerosol forcing is strongly overestimated.
Aerosol forcing strength in the North Atlantic was on the increase from post-WW2 then declined from around 1980, and globally it was roughly flat since then. The simplistic expected NA upper ocean heat content response in a model which strongly overestimates aerosol forcing should therefore be a decline to 1980 and then a sharp uptick to present. But that’s not what we see: there is the decline to 1980, but from there it remains basically flat up to the end point at 2004. However, the expected pattern is exactly what we see in NA SSTs. The authors appear to suggest that the overall flatness of trend is due to overactive aerosol forcing, but if that were the case we wouldn’t see the post-1980 robust strong warming of North Atlantic SSTs in the model.
In fairness to the authors, what they actually say is ‘aerosol effects are strongly overestimated’, not specifically forcing. In particular they point to a strong positive trend in sub-polar sub-surface salinity in HadGEM2-ES which appears to result from the influence of aerosol increases. And that may well in turn be influencing NA upper ocean heat content in the model. It could be that this particular model has some overactive dynamic response to aerosols, resulting in the salinity trend and further knock-on effects. But that doesn’t necessarily mean the forcing is overestimated. From what I’ve seen, other models with similar or even stronger aerosol forcing do not produce this salinity response, nor flat NA upper ocean heat content trends post-1980.
Richard: Figure 1 of you paper shows the weekly evolution of SO2 in the vicinity of Iceland for each of eight weeks beginning 9-1 to 9-7. The localization and concentration varied dramatically over this period. Week 1 has the strongest and most localized signal. Given the nature of this data, I was hoping to see the cloud brightening effect of aerosols for each of these weeks, not combined data for the second month. It great spacial-temporal signal has been reduced to a single month.
My comment was lost by your university’s system, which responded
“Security Error
Your request has been blocked due to security concerns. If you believe
your request to be valid, then please contact the University Helpdesk.
with the following information:
IP: 86.151.29.32
Date: Saturday, 29 July 2017, 17:03:31 BST”
That is nor very friendly. What is wrong? I’ve not had this problem at other blogs.
Apache at http://www.climate-lab-book.ac.uk
Sorry Nic – the blog is hosted on the University servers and I have had similar problems before with other people’s comments because the security settings are too sensitive I think. Will contact IT (again) about this. It is frustrating!
If you want to post something then email me and I can add it manually. Did the comment include several links? That has previously triggered security concerns….
Ed.
Relevant discussion article popped up at ACPD a couple of weeks ago, purporting to find a significant LWP response from analysis of the same eruption and suggest that the results indicate stronger negative cloud-aerosol forcing than previously thought.
They partly attribute their apparent contradictory finding to using a larger amount of control observations in order to distinguish signal from noise. And also suggest that using a high-resolution convection-resolving model, rather than the traditional GCMs used in Malavelle et al. 2017, provided a more realistic LWP response.
Though they do note that their results are sensitive to uncertainties in aerosol transport.
Fascinating, very nice sharing.