A new paper out this week in PLOS Biology uses some CMIP5 simulations of daily mean surface air temperature as part of a larger analysis on the change to future plant growing days. The description of the analysis suggests they have not used the simulations appropriately to arrive at their conclusions. Here I highlight a couple of possible pitfalls in using such data in impact studies.
Firstly, using GCM simulations to make robust projections of climate impacts is hard.
Really hard.
This is especially true when daily data is being used and the impacts depend on thresholds because the statistics of the raw simulated variations are not the same as the real world.
For example, if you wanted to calculate the change in the number of days above or below a temperature threshold, then a naïve use of such simulations would be to count the number of days in present day and future periods and subtract one from the other.
Big mistake.
As an example, we pick one location and one simulation to illustrate the issues, although this is an entirely general problem and not specific to any location or model simulation.
The figure below shows mean daily temperature in Central England – observed in blue and simulated by a particular climate model (BCC-CSM1) in red. This is just an example from data I had available.
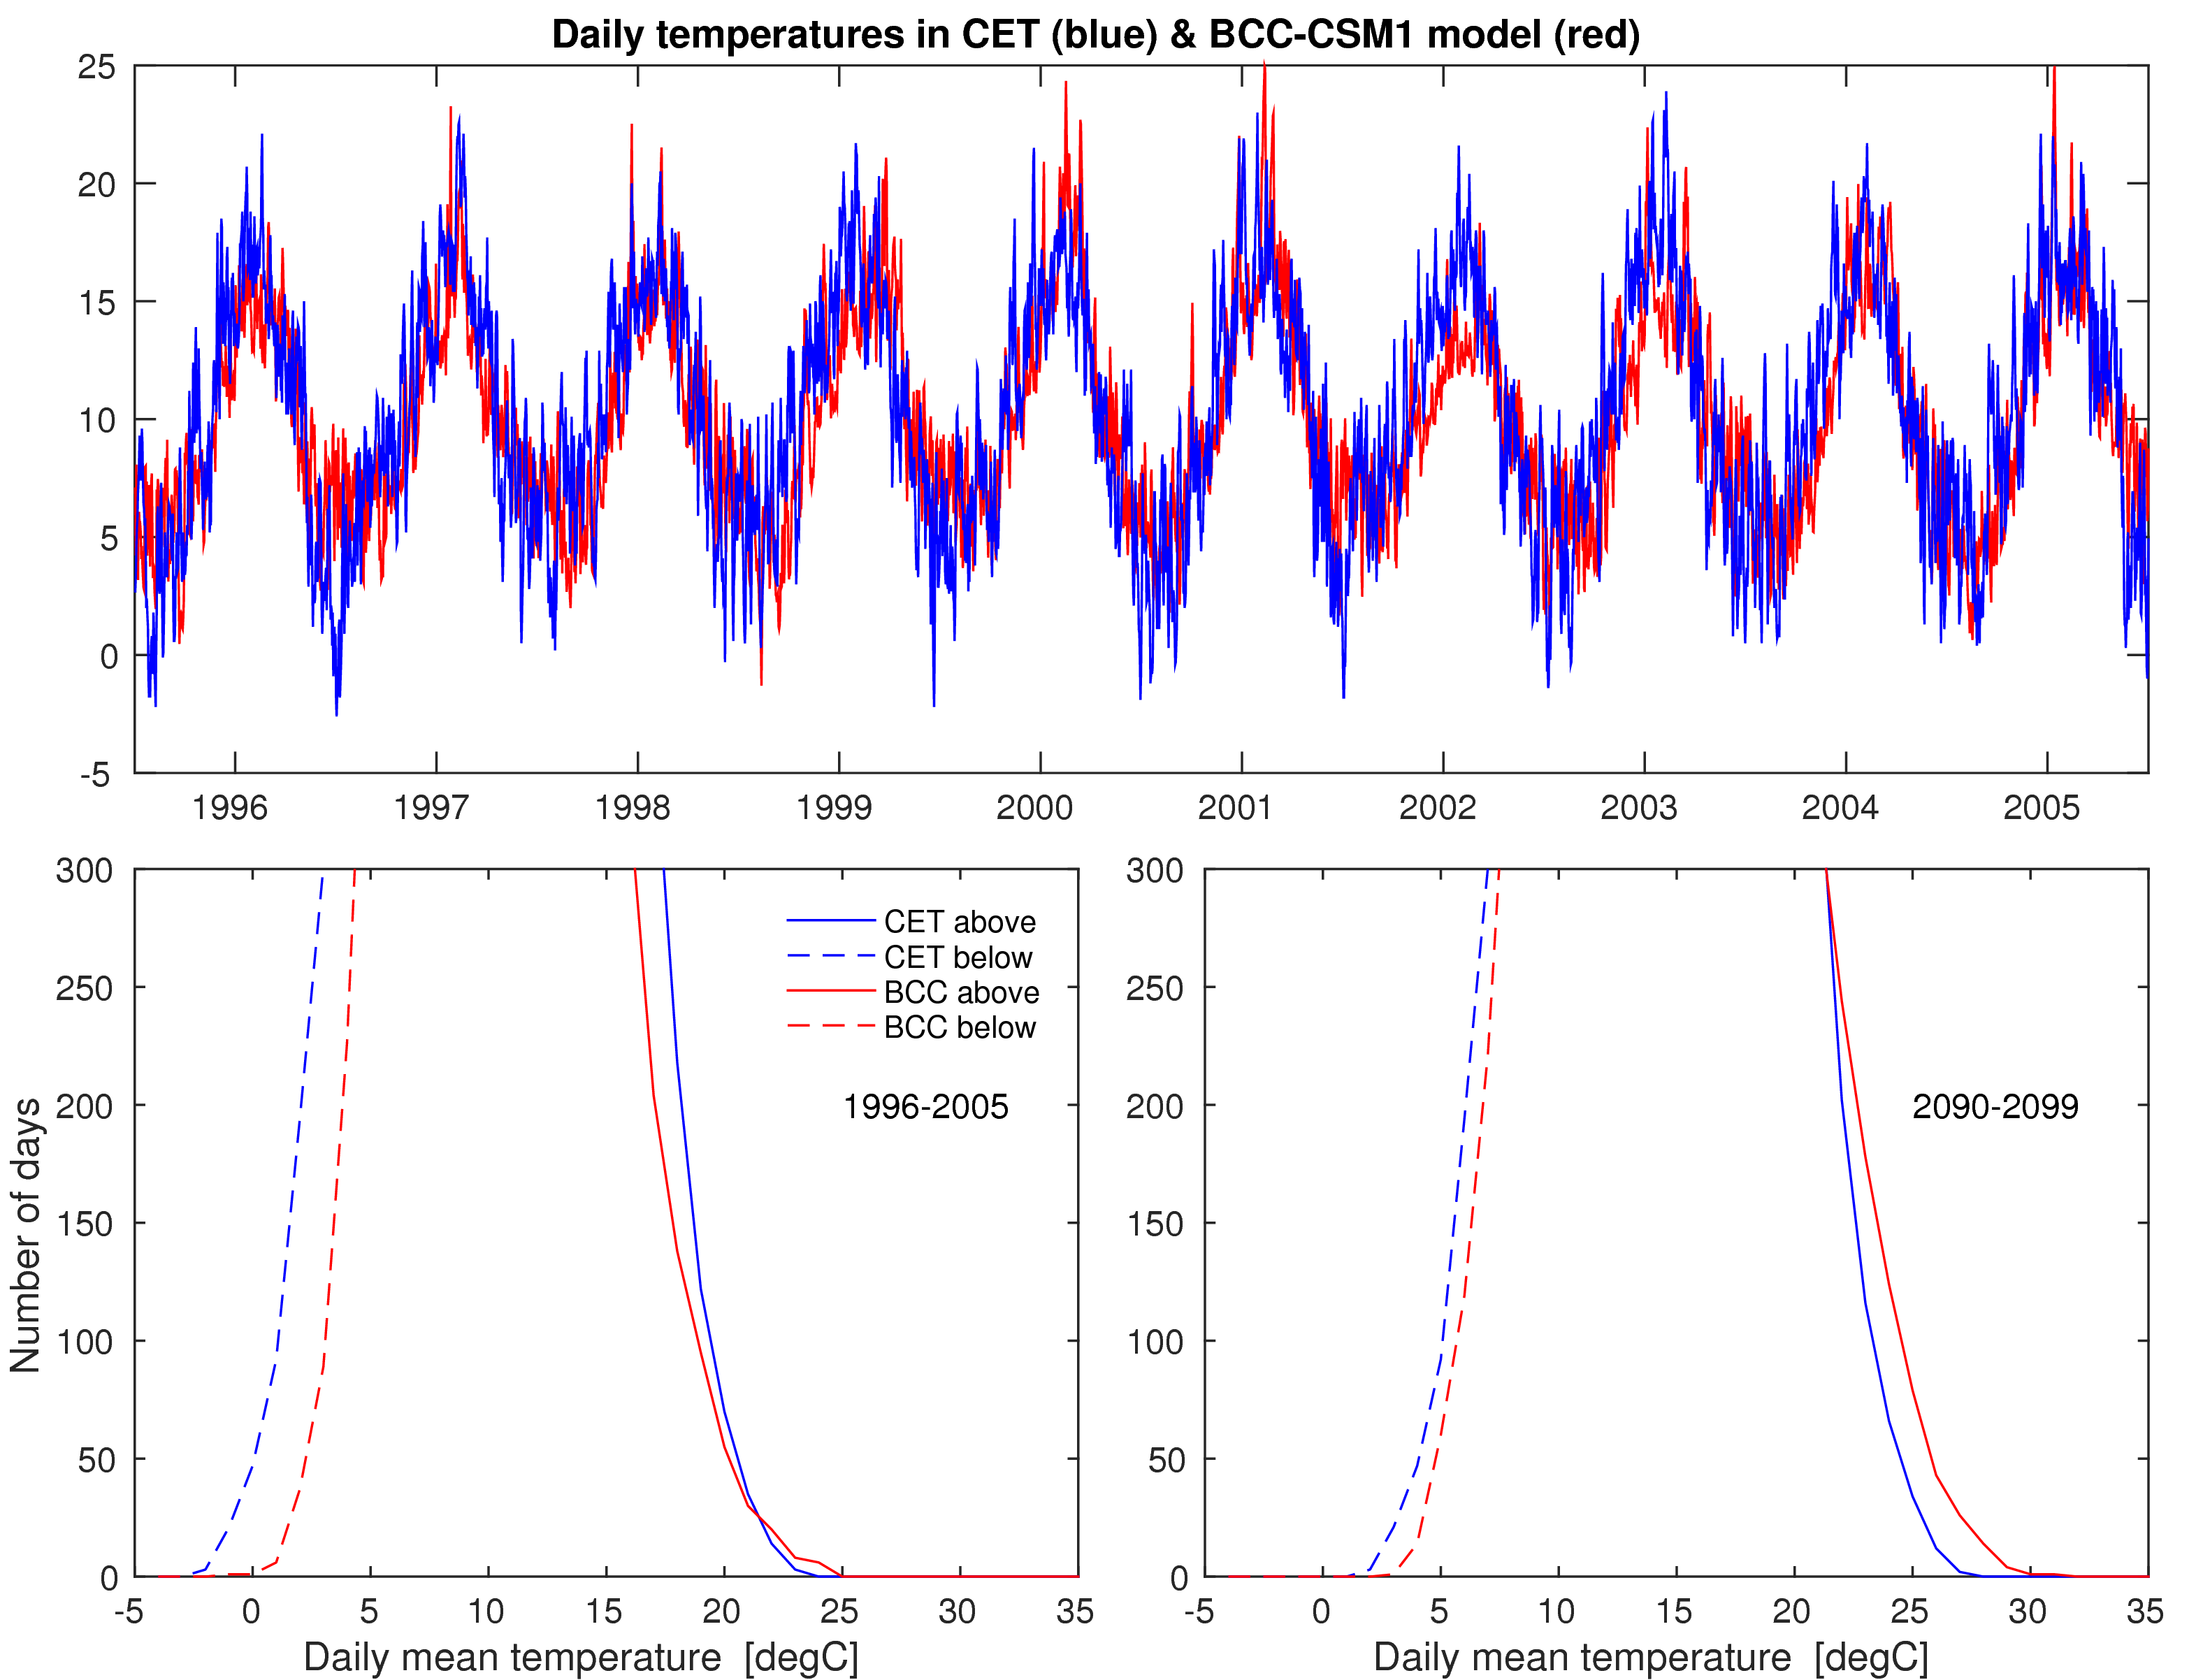
The timeseries for a recent period (1996-2005) look similar by eye (top panel). The means are only 0.3°C different but, critically, the variance of the observations is 40% larger than the simulation.
If you count the number of days above and below temperature thresholds (bottom left) you see that the observations have 47 days below 0°C, but the simulation only has 1 day (dashed lines). The simulations and observations also have different numbers of days above each particular threshold (solid lines).
This should set alarm bells ringing for the use of raw simulated data to calculate changes in days above or below thresholds.
In the future (2090-2099, under RCP8.5), the simulation is 3.9°C warmer than present (bottom right). There are now zero simulated days below 0°C. If we make the (too) simple assumption that the real world warms by the same 3.9°C, then the observations would also have zero days below 0°C in future. But, the change from present is −47 days, rather than −1 day. The estimated change in days is wrong because the statistics of the daily variations are different in the model from the observations (see footnote 1).
My understanding of this recent paper is that they calculate the change in the number of days above, below and between certain thresholds and average across the different models. But they have (seemingly) not accounted for the biases in the statistics of the daily variability as simulated by the different models.
You cannot simply just use the multi-model average either. It doesn’t work like that. There is a range in the projections of future climate because climate sensitivity is uncertain, and this needs to be acknowledged and accounted for appropriately.
Neither do they consider issues of uncertainty in the observations or uncertainty in the many other complex steps in their analysis – which apparently also have major issues.
Simply, if you use raw daily simulations from CMIP5, then your impact estimates will almost certainty be incorrect. Of course, accounting for these biases is no simple matter and has its own uncertainties, but the biases certainly should not be ignored.
This conclusion will not be a surprise to many of those who use such simulations to make impact projections. There are several published techniques that attempt to address the issues of simulated biases (e.g. Ho et al., & applied to a real example). There are also entire research programmes on the topic of making better impact projections (e.g. EQUIP, HELIX, AVOID2) – the key is assembling a multi-disciplinary team with expertise in all the different aspects.
Footnotes:
1. Using 10-year periods is not long enough to fully sample the natural variations in climate, but was chosen in the recent study. Using a longer, say 30-year, period would not solve the issues outlined above.
2. The simulated daily variance increases by 37% in the future and this also impacts the results – the change of the entire distribution of daily temperatures is crucial when assessing days over thresholds, and these changes will be different from model to model.
Wholeheartedly agree with your take on this one Ed and I’ve only read the abstract!
As a grower I can vouch (from painful experience) that the “weather” can make or break those whose livelihood depends on it. Weather “noise” can be really extreme, your example of the CET is very pertinent. 2014 was record warm but without any extremes, basically a “Garden of Eden” for most growers.
My own take is that is that we need to get the modelling of the oceans right before we can make adequate attribution and impact assessments in future scenarios. There are plenty of papers showing the “persistence” of the AMO, it’s been linked to the “Dust Bowl” and drought in the Sahel by example. These rely on global patterns of SSTs setting up atmospheric pressure gradients that will impact specific regions in a predictable fashion. The same holds true for ENSO and throw in the MJO for good measure. Plenty to do 🙂