A new study in Nature has highlighted that parts of the Antarctic Peninsula have showed a cooling trend over the past couple of decades. Should we be surprised?
Turner et al. produce a ‘stacked’ estimate of temperature change on the Antarctic Peninsula by averaging together observations from six stations and highlight that the strong warming trend since the 1970s has reversed since the late 1990s:
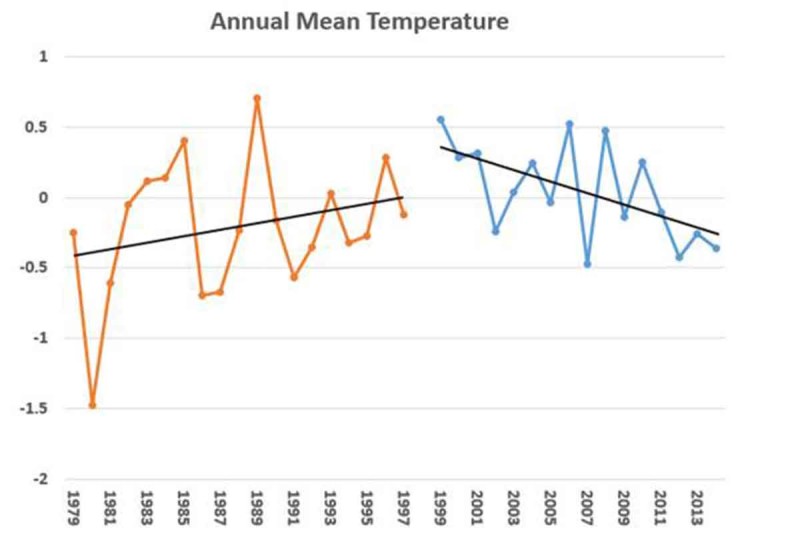
[As an aside, four of the observation stations which (by eye) show the strongest cooling are right on the tip of the Antarctic Peninsula. The other two are further south and do not appear to show such a strong cooling. Whether a simple average of these correlated stations is an appropriate representation of the whole Peninsula is an open question.]
Why is this result not a surprise? It is well known that natural decadal variations in regional weather can temporarily overwhelm any trends due to changes in radiative forcing. At any one time there will be places on the planet which are bucking the long-term trend.
But, the region around Antarctica is special – it is a region where the signal-to-noise ratio of expected changes in air temperature is relatively small. The figure below shows the multi-model mean CMIP5 simulated change in air temperature over the 21st century divided by the simulated amplitude of natural variability – the signal-to-noise ratio:
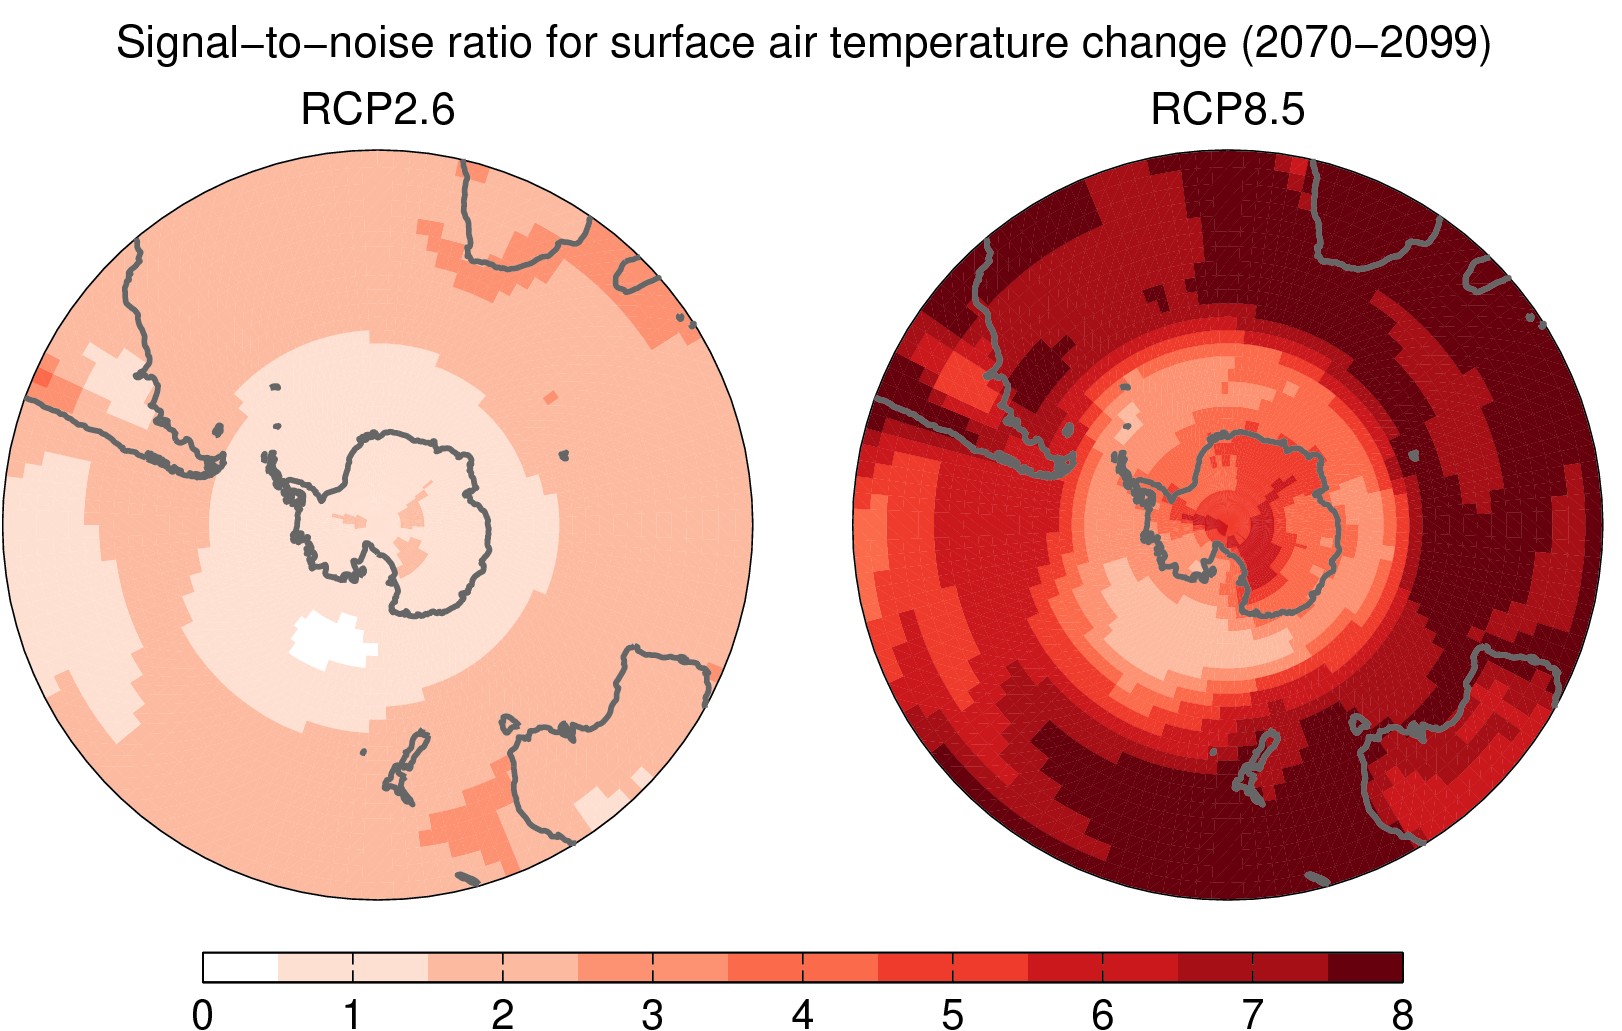
The GCMs therefore suggest that the anthropogenic signal in air temperatures is very slow to emerge from the noise of variability in this region – entirely consistent with what Turner et al. suggest. This region is also special because it is influenced by changes in stratospheric ozone which complicate the attribution of any observed trends.
More evidence, if it were needed, that the role of natural variability is important when examining short term trends.
The trend for 1979-1997 was 0.32°C/decade and -0.47 for 1999-2014. It would appear the trend for the whole period was negative, but I don’t have access to the full paper.
Hi Robert,
You can see the individual time-series on the CarbonBrief coverage of the paper:
https://www.carbonbrief.org/natural-forces-overpowering-antarctic-peninsula-warming
There is data going back into the 1940s but not for every station.
Ed.
Eyeballing the temp data from the graph above, I calculated a slope for the 1979-2013 period of 0.1°C/decade. However, the p value was only 0.21, not significant.
That wouldn’t be surprising for many reasons, including:
* general cooling of the Southern Ocean
* sea ice dynamics mean thicker or thinner ice around can cause trends
* Radiative Forcing from CO2 being negative during winter over the interior highlands
* other?
Others? Yes, quasi-stationary Rossby waves propagating from tropical or subtropical western Pacific. It has been already known by people from the South that they cause overall cooling in summer (and spring) over the northernmost Antarctic Peninsula. We would say it is part of regional climate variability at interannual and longer time scales. Please, have a look at: SOUTH PACIFIC QUASI-STATIONARY WAVES AND ANOMALOUSLY COLD SUMMERS IN NORTHERNMOST ANTARCTIC PENINSULA, available at http://ppct.caicyt.gov.ar/index.php/geoacta/article/view/917/1392
Comparing this paper with Alison Cook’s: As you mentioned, the Vernadsky and Rothena stations appear to show warming, whereas the others don’t. This would fit in with the Cook paper, which covered a bigger area and at greater depth (rather than just SST).
The restricted area covered by Turner et al falls within the cooling area of the AP. It does not cover the West, South West, or South South West areas which show temperature changes of >+1°C. (SST) and +1.75-2°C at 400m.
Given the limit geographical range of J Turner’s paper, I think it’s rather cherry picking to say that what is happening to the North and East of the AP is happening to it all.