One possible criticism of global temperature datasets is that before around 1900 the observed data is too sparse to reliably infer changes in global temperature. Although we cannot travel back in time to take extra measurements to fill the gaps we can test whether the available observations are enough. Continue reading Sparse coverage of temperature observations
Monthly Archives: December 2016
U.S. Deep Freeze, December 2016
There had been speculation that record low temperatures would be coming to the United States in early December, and this had been framed as either evidence against global warming in general or that cold air outbreaks are increasing due to climate change.
World Weather Attribution (WWA) presents a quantitative study of this cold air outbreak. WWA researchers compute how rare the outbreak was and how it is affected by human-caused greenhouse gases. The analysis uses the same methods as WWA used in the peer-reviewed analysis of the cold extremes in the Midwest in the winter of 2013 – 2014 (van Oldenborgh et al, 2015). Continue reading U.S. Deep Freeze, December 2016
Climate graphics of 2016
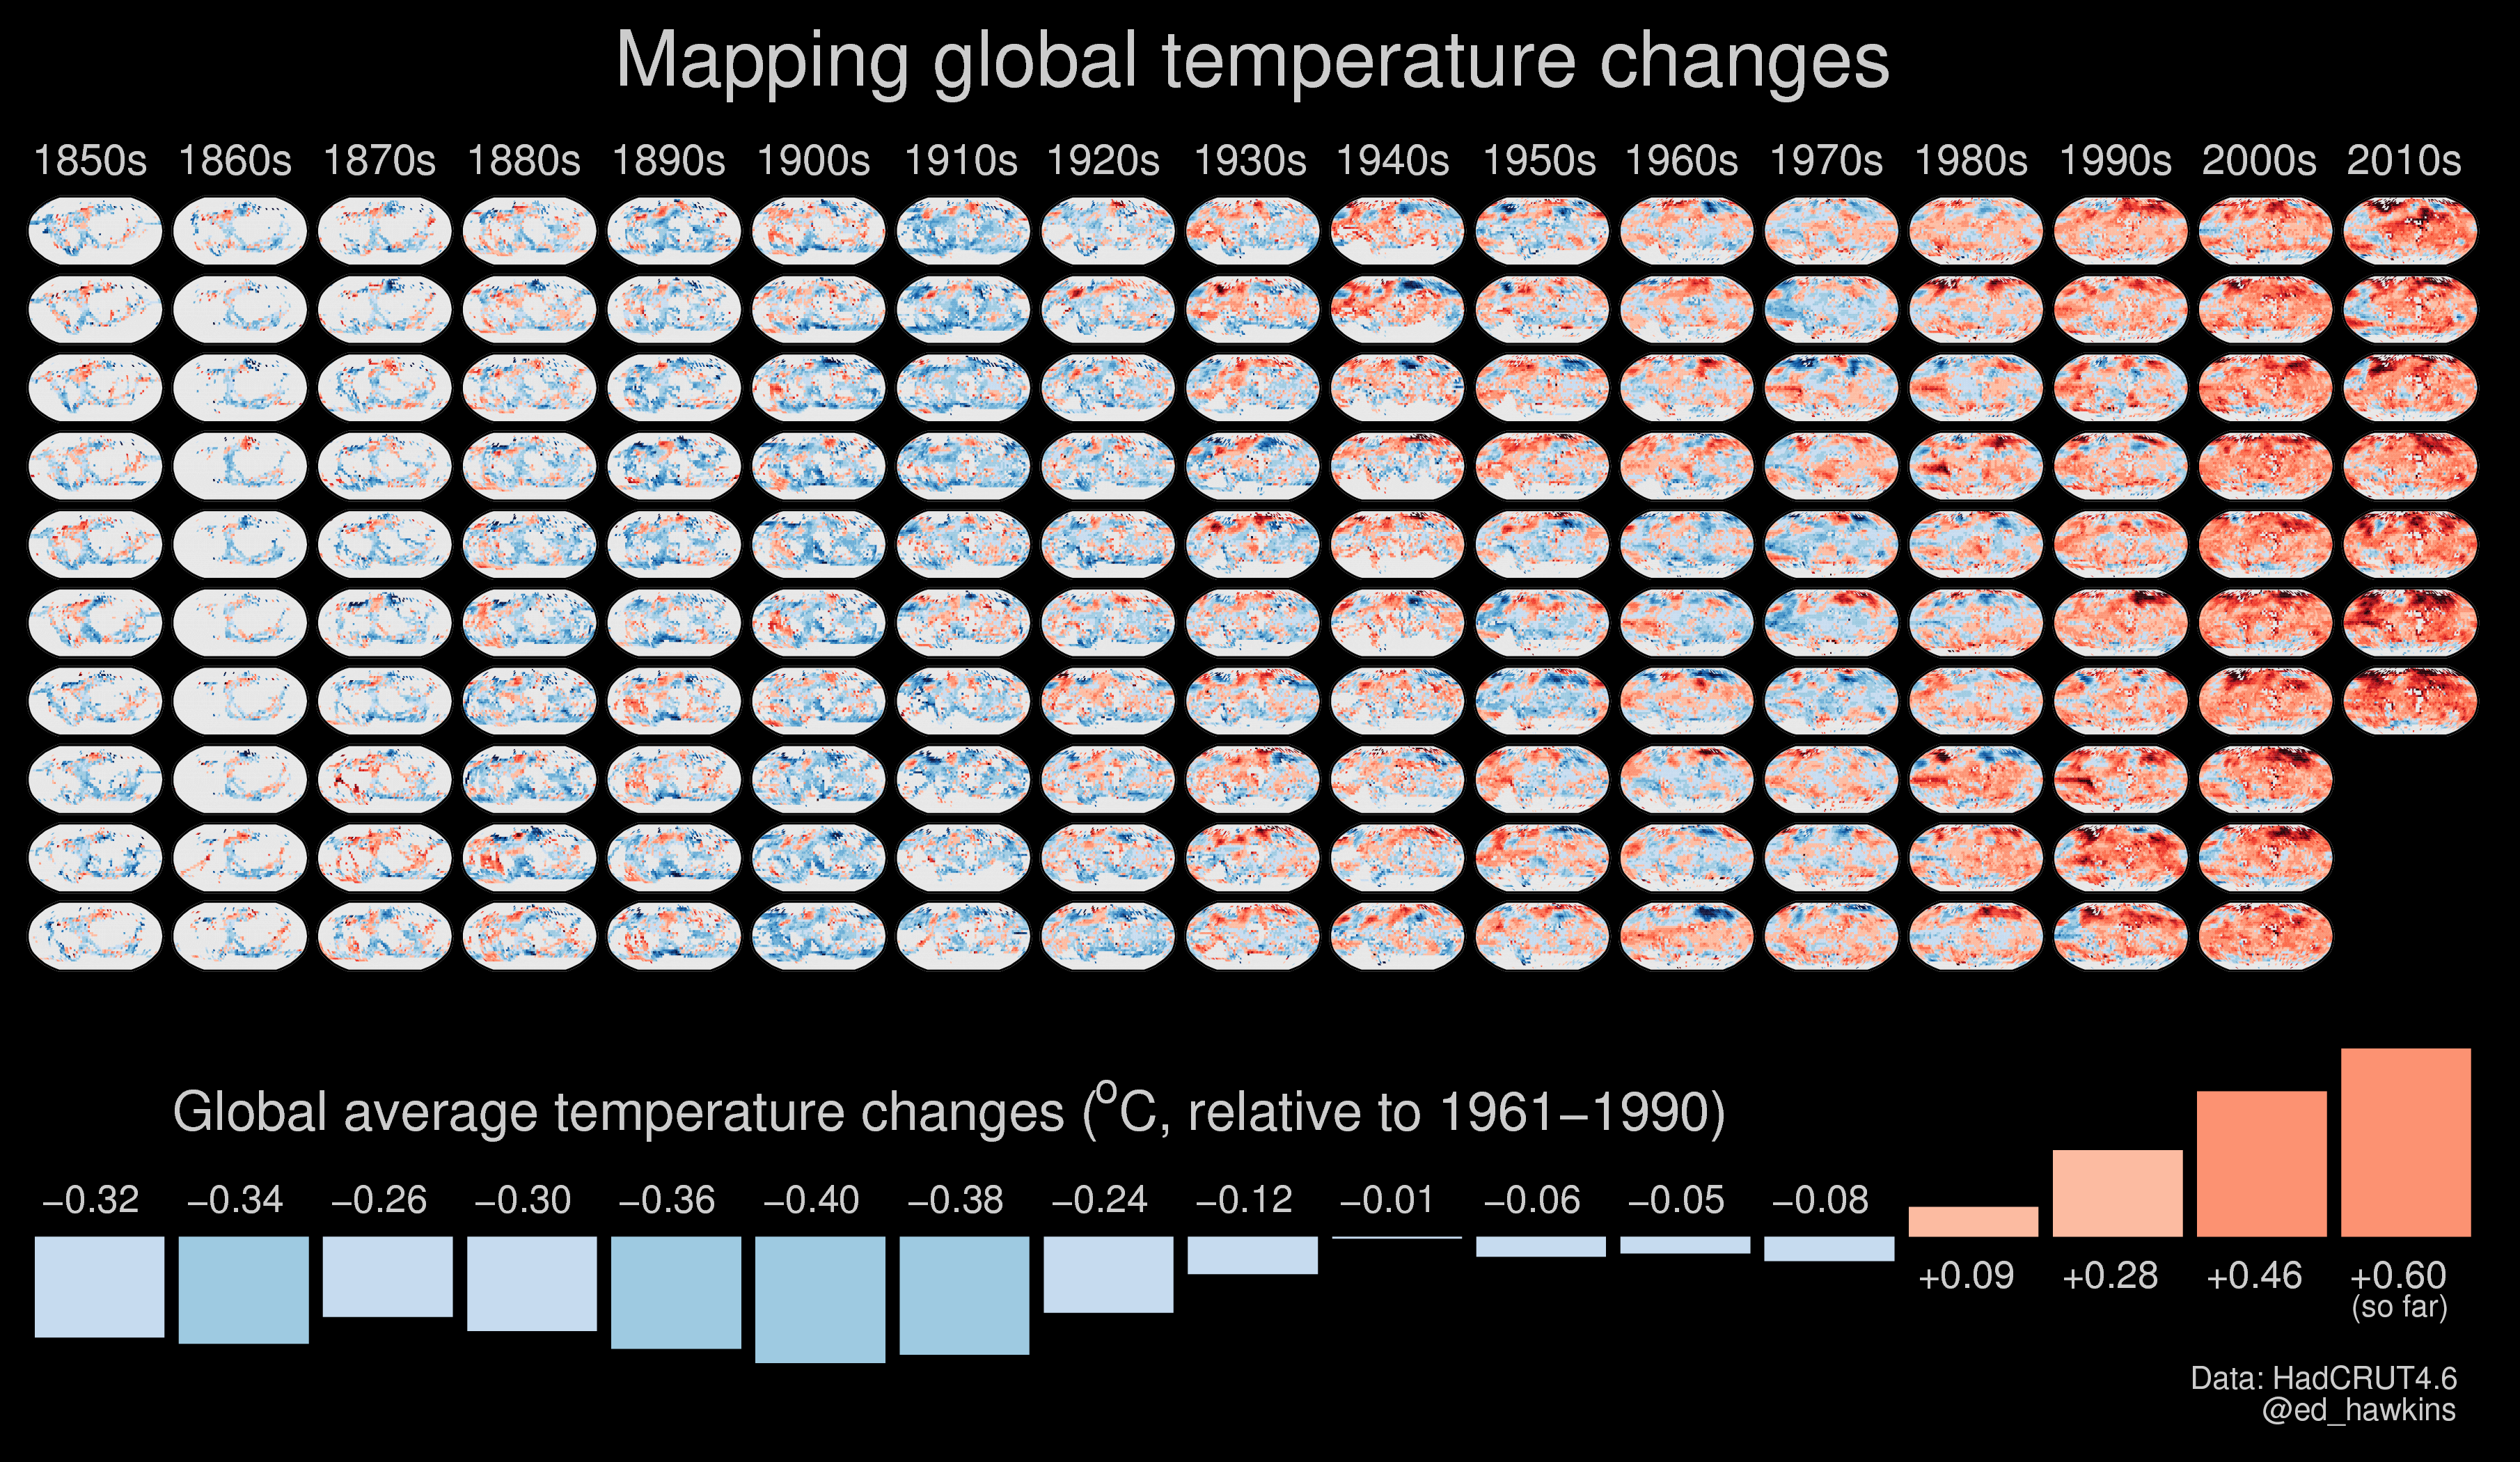
2016 has been quite a year for the climate. Warmest year ever recorded. Record low sea ice extents at both poles. It has also seen many amazing climate visualisations and animations. I have collected some of my favourites on this storify page, including graphics for temperature, sea ice, pressure observations and Hurricane Matthew.
One of the graphics is shown below, mapping temperature changes from 1850-2016, and including the decadal averages of global temperatures. This graphic has been updated from a previous version.