Much attention is rightly given to changes in global mean surface temperature – it is the key metric for assessing how our climate is changing and evaluating mitigation strategies. However, no-one directly experiences changes in global mean temperature – it is only through local variations that changes in climate are felt.
So, what have global temperatures ever done for us?
[with apologies to Monty Python’s Life of Brian]
It is perhaps surprising that the fingerprint of a warming climate is clearly emerging on very small spatial scales and our new paper examines this topic.
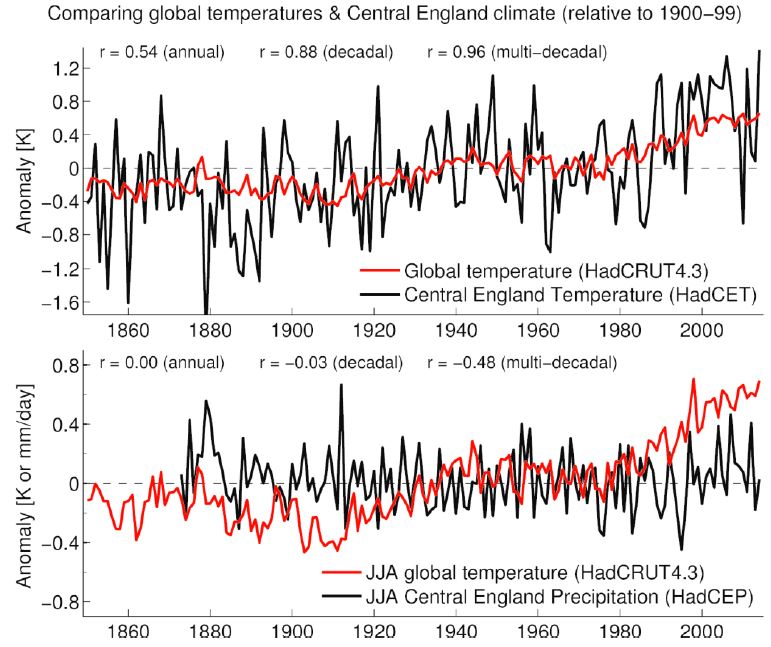
Consider central England – an area which occupies just 0.005% of the planet’s surface. For this region, the year-to-year variability in annual temperatures is much larger than for a global average (Figure 1) – this is obviously because such small areas are sensitive to fluctuations in the weather, and these fluctuations are spatially averaged in a global mean.
But, note that the familiar features of the global temperature record are clearly visible by eye in the central England record too, just overlaid by the large annual fluctuations. When averaging over multi-decadal timescales, the correlation between the global and local timeseries is r = 0.96. In this instance, averaging over time is similar to averaging over space (also see animation in Figure 2).
For summer precipitation in the same central England region, the signal of a changing climate is far less clear – there is a small decline in rainfall with increasing global temperatures, but the correlation on multi-decadal timescales is much lower than for temperature (r = –0.48).
Is this type of relationship true in other locations? Figure 3 shows the regression between local and global annual temperatures. In nearly every location, local temperatures are related to global changes, with generally larger regression parameters over land as expected. Global temperatures explain large fractions of the local variance in temperature in most locations.
But not everywhere. One obvious example is the North Atlantic, where local temperatures vary in a way that is apparently unrelated to global temperature (Figure 3). This is thought to be due to large fluctuations in the strength of the deep ocean overturning circulation which cause the observed variations in this region. The observations of this deep ocean circulation show that is slowing currently, although it is not yet clear why.

To summarise, if you had measured temperatures in your back garden for the last 150 years you would probably be able to see the signal of global temperature change emerging from the noise of local fluctuations. For rainfall, this would be far less clear. Conversely, global average temperature describes the overall trajectory of temperatures at virtually every location – which is one of the reasons why it is such an important metric of climate change. Read more
Paper: Sutton, Suckling & Hawkins, 2015, ‘What does global mean temperature tell us about local climate?’, Phil. Trans. A, 373, 20140426, doi: 10.1098/rsta.2014.0426
Neat stuff Ed! CET is after all a useful proxy for GMST. Anyone got an overlay of CET and AMO?
In keeping with the spirit of the post “What did the Roman warm period ever do for climatology ;)”?
Ed,
I particularly like the second half of the figure 2 animation, going from the global temp with 31-year smoothed CET, through decreasing CET smoothing, until you get to unsmoothed CET. This sequence is convenient way to think about climate: global-scale externally forced signal, with some regional multi-decadal fluctuations superimposed, with some local shorter timescale “weather” superimposed. It seems more intuitive than starting with local data and trying to think upscale towards the global mean.
Are the correlations Sutton et al. report significant in any statistical sense? Those smoothed time series look to be very strongly auto-correlated.
It would probably have been more meaningful to calculate the correlations between annual means / 5-year means / 10-year means rather than on smoothed time series?
Hi Rob,
The strong autocorrelation is part of the point – we are seeing a long term trend. The correlation of annual means is in Fig. 1 (r = 0.54). I suspect 10-year means would be similar to the decadal smoothed average, but I haven’t calculated it.
Ed.
Ed,
What is really interesting is that the decadel warming trend of CET temperatures actually started from 1650, with an absolute minimum around 1680 dipping down to ~8.4C. That was some 0.6C colder than 1850.
As you say CET decadel temperatures after 1850 agree well with Hadcrut4 once you scale up H4 anomalies by adding 9.4C. I would argue though that it is not really until 1980 that any ‘enhanced’ warming is evident.
A couple of years ago I looked at heatwaves in the CET. I took my definition as the 5 days or more of more than 2 stdev above normal. I would have preferred to use max temp but the CET does not record that fully. Anyway there are various definitions. Unsurprisingly I detected more heat waves today than historically. This is unsurprising since I defined normal on a baseline from1780-1930 and today’s avg temperatures are much hotter. Most of these heat waves occurred in winter.
Then I though I could use MET office record for Eng & Wales precipitation for a similar task to define 5 or more days of 2 stdev above avg precipitation. Again I saw an increase in the number of wet periods in today’s climate as I saw for temperature. Although this is 2 stdev above normal that is far from what anyone would call extreme weather; more a case of damp than floods.