Current global temperatures are often discussed in terms of their unprecedented nature when compared to the last few thousand years. An interesting paper in Nature Climate Change by Steven J Smith and colleagues examines the rate of warming projected by the CMIP5 ensemble and suggests that the rate of warming is unprecedented also. However, we note here that their projections are not constrained by the current observations which do not show such strong warming rates at present, and are unlikely to do so in the next few years.
Guest post by Richard Betts (with Figure 3 by Ed Hawkins)
Smith et al rightly point out that the rate of change is a critical factor in climate change impacts, especially if the change is so fast that it cannot be adapted to. We discussed this in the IPCC Working Group 2 report:

Smith et al note that the projected rates of warming are faster than those seen in reconstructions over recent centuries, and discuss the implications of uncertainties in transient climate response and aerosol forcing – it’s an interesting and useful analysis. However, much of the media coverage of this paper focussed on a somewhat surprising statement in the abstract:
The rate of global-mean temperature increase in the CMIP5 archive over 40-year periods increases to 0.25±0.05 °C/decade by 2020
This is surprising because global mean warming has proceeded more slowly over the last decade and a half or so – the so-called warming slowdown or ‘hiatus’. After a warming rate of around 0.26 °C/decade in 1984-1998, the rate slowed to about 0.04 °C/decade in 1998-2012 (IPCC WG1 Chapter 9 Box 9.2).
Will warming really accelerate again enough to give a 40-year warming rate of 0.25 °C/decade by 2020?
The authors do acknowledge the observed recent slowdown, and they present the observed warming rate in one of their figures, which uses a simpler climate model (see figure 4a in Smith et al.). However they do not factor this into the projected 40-year warming rate by 2020. (To be fair, we did not do this in our IPCC figure either!)
We suggest that one way to account for recent observations is to use the constrained near-term projections presented in IPCC WG1 Chapter 11 (Figure 2). This figure took the range of warming rates from CMIP5 and applied these to a more recent baseline. This acknowledges that while the projected warming rates may be realistic, the warming in coming decades is now starting from a lower point than in the projections.
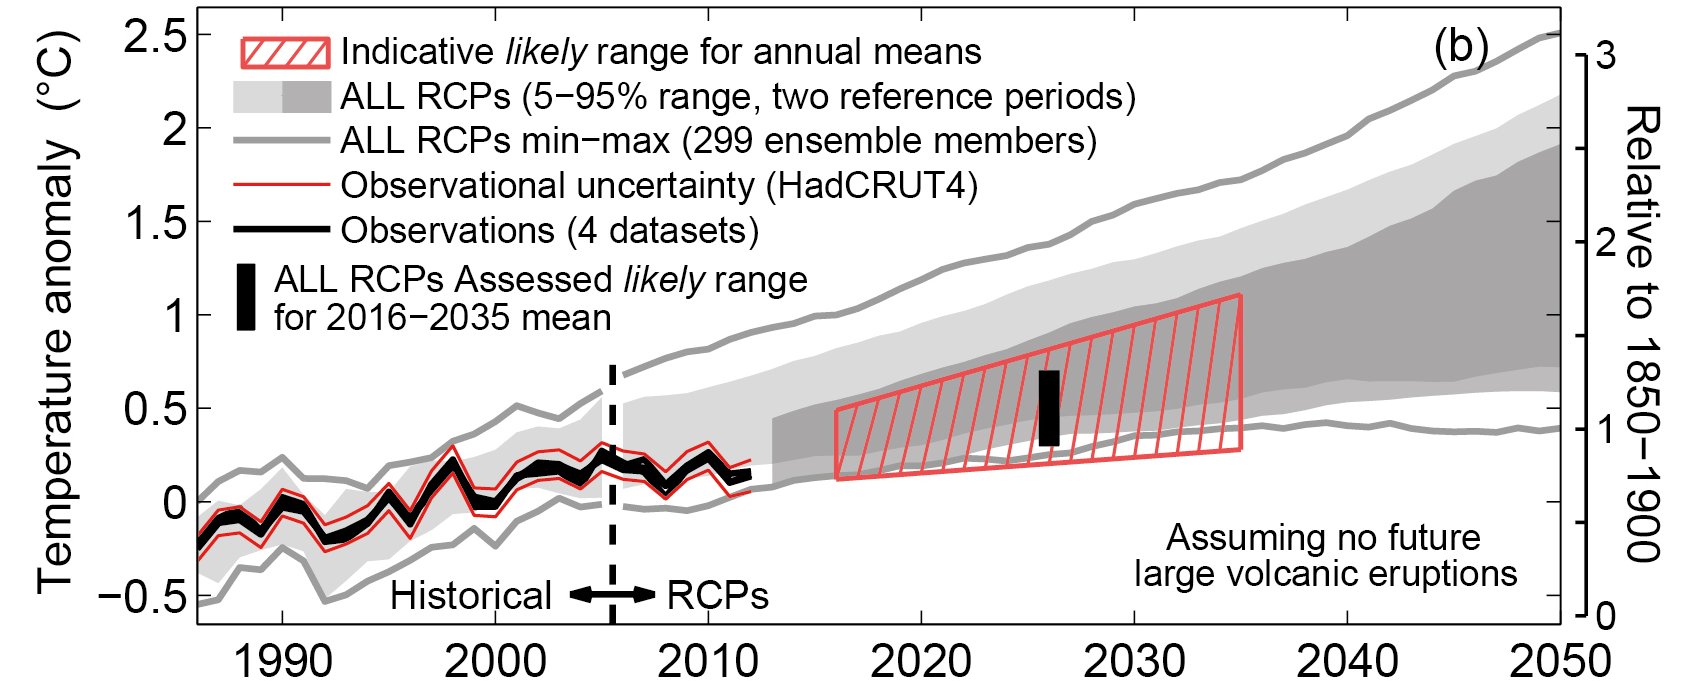
Using this in combination with the observed global mean temperature allows us to estimate the 40-year warming out to 2035 taking the hiatus into account:
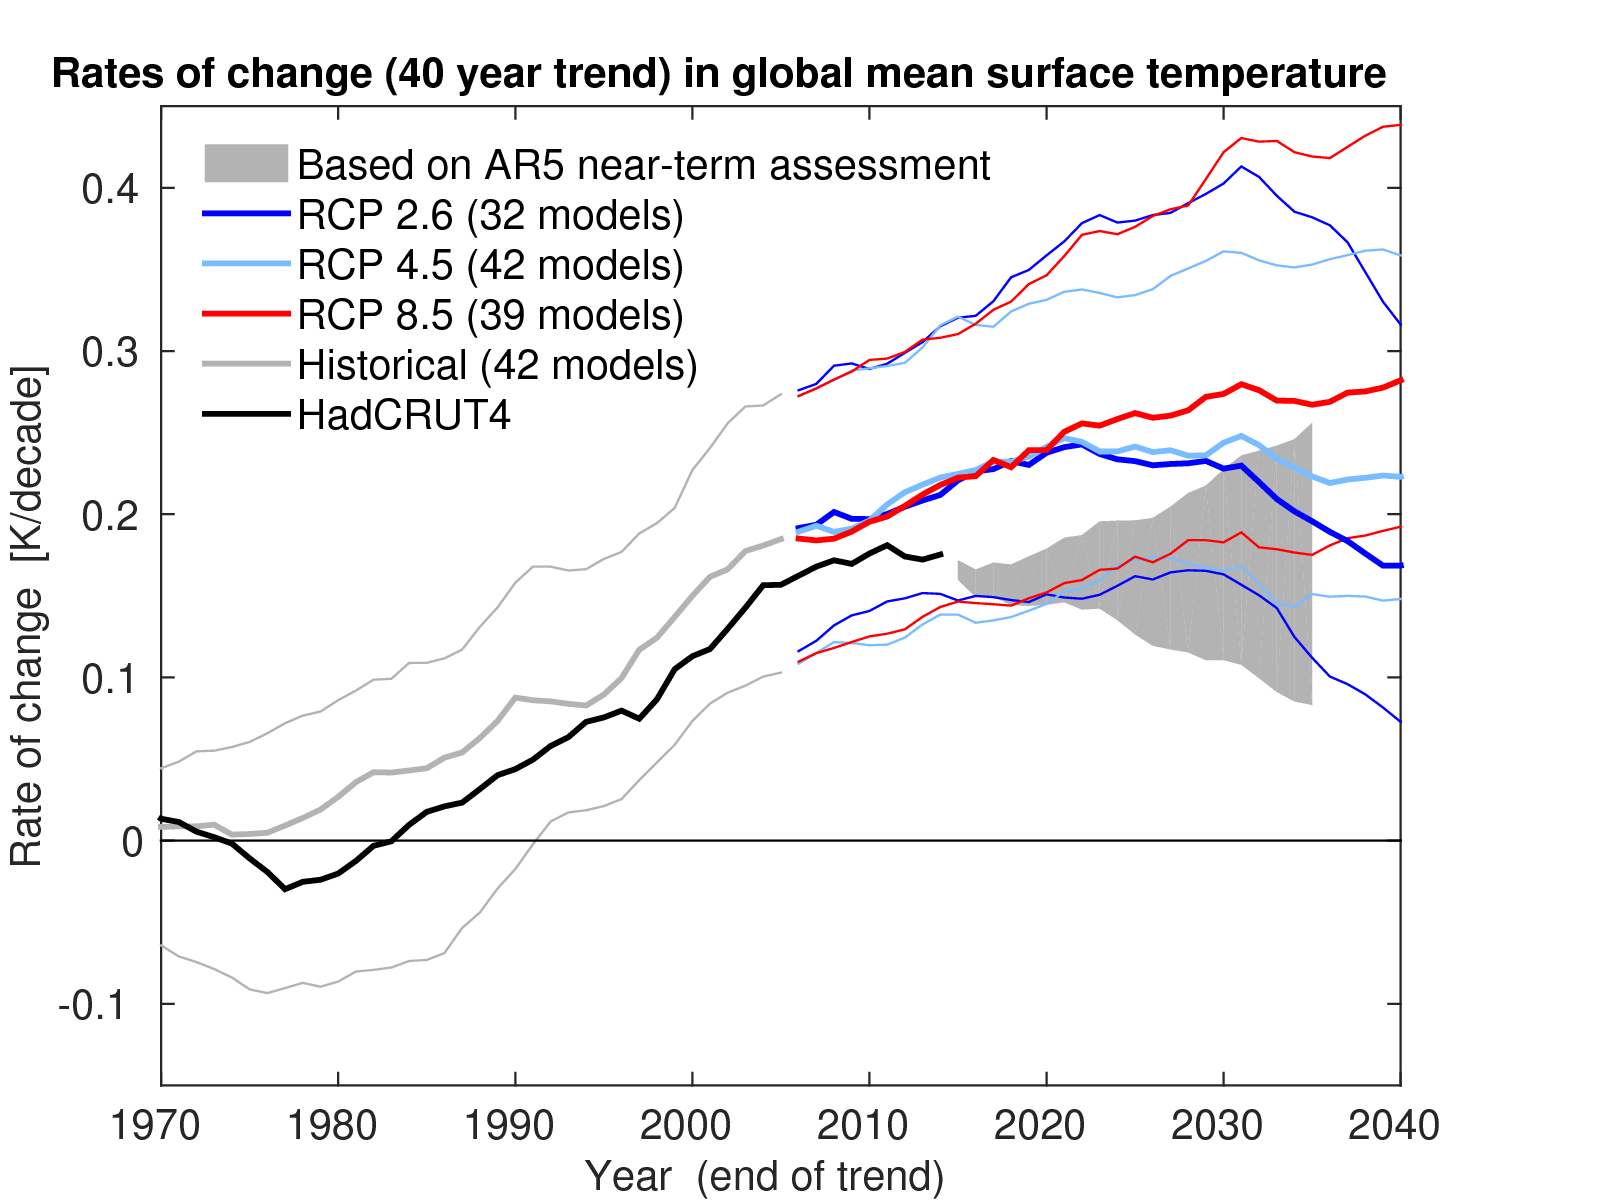
Doing this, and assuming of course that the IPCC’s ‘assessed likely range’ is realistic, we find that the 40-year warming rate is actually expected to reduce a little over the next 5 years or so. The 40-year rate peaked at about 0.18 °C/decade in 2011 and then drops off a little by 2015. This is due to a few cold years in the 1970s dropping out of the 40-year period. The 40-year rate is then projected to be between 0.14 and 0.18 °C/decade by 2020. By this method, Smith’s central estimate of 0.25 °C/decade looks unlikely to be reached by 2020.
The wider point made by Smith et al still stands – there is a clear risk of rates of climate change exceeding those in recent centuries, especially if greenhouse gas emissions continue to increase. Recent 40-year warming has already been unusual in the context of the last millennium, but possibly not completely unprecedented. However, our brief analysis here suggests that the recent hiatus may have put off the time at which 40-year warming exceeds that seen in the last millennium. Nevertheless, this may still happen within the next two decades. As Smith et al discuss, a key factor will be the transient climate response.
Most climate scientists outside the MetOffice and NOAA agree that Cowtan and Way provide a more reliable estimate of recent temperature change. They find a trend of 0.11C per decade for 1998-2012. For 40-year trends they find 0.19C/decade to 2010 and 0.18C/decade to present. Thus the 40-year trend is higher and dropping more slowly than indicated in HadCrut4. Accordingly a more realistic 2020 projection would be 0.16C-0.20C per decade.
I do agree with the general thrust of your remarks however (as I’ve already tweeted).
Thanks for commenting. Yes, the result would be sensitive to the choice of observational dataset – interesting to see that this is only small though, even using Cowtan & Way. The upper end of your C&W-based range still only just touches the 0.25 +-0.05 C/decade range in the raw CMIP5-based estimate.
I was going to make a similar point. It’s quite possible that the 40-year warming trend now is in excess of 0.18K/deg and so suggesting that the range by 2020 will probably be between 0.14 and 0.18K/deg seems to be suggesting a lower upper limit than might be reasonable. It doesn’t seem all that implausible that it could reach 0.20K/decade.
In fact, I’m quite surprised how low the lower limit is, given that that would seem to imply very little – if any – warming over the next 5 years.
@ATTP
Thanks. Another recent Nature Climate Change paper, by Chris Roberts, Matt Palmer, Doug McNeall & Mat Collins, said:
the probability that an existing 15-year hiatus will continue another five years is …. up to 25%
So while the lower limit implying little further warming seems less likely, it’s not out of the question.
I was thinking of that when I wrote that comment, so yes, I realise that it’s not impossible. But my quick calculation suggests that if the current 40 year trend is around 0.18K/decade, then to get 0.14K/decade by 2020 would require cooling by almost 0.1K in the next 5 years, rather than simply no warming. Even the slowdown has been warming at around 0.05K/decade, so cooling by 0.1K in the next 5 years would seem rather remarkable.
Okay, I think I made a mistake. 0.14K/decade in 2020 would require no warming – on average – between now and 2020.
I don’t think it really matters whether current warming is 0.04C or 0.1C/decade. The evidence is that between AR4 and AR5 very little surface warming actually occured. This is a big deal whichever way you look at it. Despite this pause in warming our ‘certainty’ on AGW has apparently grown since AR4, but this is all based mainly on believing in the validity of models rather than measurements. I am personally convinced of the underlying physics behind (first order) enhanced GHE of increasing CO2, but recent models are assuming much more than that and this is dangerous. For example they are assuming that an ever increasing fraction of CO2 emissions will remain in the atmosphere to offset otherwise benign logarithmic forcing so that temperature response becomes far more scary linear response to emissions. There is as yet no evidence whatsoever that this is hapenning. Slightly more than half CO2 emissions are absorbed by natural sinks.
Looking back over the history of the IPCC, we find these headline statements.
1990 AR1: ‘The unequivocal detection of the enhanced greenhouse effect from observations is not likely for a decade or more. ‘
1995 AR2: “The balance of evidence suggests a discernable human influence on global climate”
2001 AR3: “most of the observed warming over the last 50 years is likely to have been due to the increase in greenhouse gas concentrations.”
2007 AR4: “Most of the observed increase in global average temperatures since the mid-20th century is very likely due to the observed increase in anthropogenic greenhouse gas concentrations”
2013 AR5: “It is extremely likely that human activities caused more than half of the observed increase in GMST from 1951 to 2010. The best estimate of the human-induced contribution to warming is similar to the observed warming over this period.”
The reason why these issues are important is because we need to know how to gauge the fuzzy relative threat from AGW against other threats like nuclear war, pandemic flu, natural disasters etc.
Is a rational assesment of risk even possible?
Hi Clive,
The airborne fraction issue isn’t really relevant to the topics of this post. However, I don’t agree with you the the Earth System Model ‘assume’ that the airborne fraction will increase – this is a result which emerges from modelling the system bottom-up from first principles (or as close as we can get to that). There’s a lot of discussion on current understanding and modelling of the carbon cycle in IPCC AR5 WG1 Chapter 6 http://www.climatechange2013.org/images/report/WG1AR5_Chapter06_FINAL.pdf
A paper led by the recently-deceased Mike Raupach suggested that the land-ocean carbon sink is already declining – http://www.biogeosciences.net/11/3453/2014/bg-11-3453-2014.pdf . I think more work is clearly needed here, but I don’t think you are correct to say that “There is as yet no evidence whatsoever that this is happening”.
But as I say, this doesn’t really have a bearing on the observational constraint of 40-year warming rates out to 2020.
Not sure what your point is regarding the history of IPCC attribution statements.
“the probability that an existing 15-year hiatus will continue another five years is …. up to 25%”
Is a probablility given for a reduction in GMST as opposed to a continued hiatus or resumed warming? If not, why not?
Rog, please read the Roberts et al paper I linked to….. 😉
Not long ago I came across this piece by Hansen on the ‘Faustian bargain’:
http://www.huffingtonpost.com/dr-james-hansen/doubling-down-on-our-faustian-bargain_b_2989535.html
In it he includes a graph of the airborne fraction since 1960. It was a fairly constant at a touch below 0.6 until the late ’80s. It has never regained that peak and is currently about 0.45.
Do I know what the climate will do – no.
Do I know what it isn’t going to – yes and it isn’t this.
Robert thanks for the Hansen link, some very interesting graphs and plenty to ponder on, ie known ocean cycles and maybe “out gassing” as a factor in how the “airborne fraction” might possibly decline even further if we do see a flip to a negative AMO.
As for the “Faustian Bargain ” that is Hansen’s eloquence trumping science, though as a blues aficionado I can empathise with musicians entering into a pact with Lucifer at the “Crossroads” to create some great music, though it didn’t necessarily end well for the musicians, they did at least leave a legacy that we all enjoy.
Climatology at the “Crossroads”?
Time for a new paradigm?
Roberts et al
“Continued hiatus periods are associated with heat uptake by the
sub-surface ocean”
In models and adjusted ARGO data perhaps.
Richard, looking at Clive’s recent post on his own site I can say that he was pointing out the IPCC have been reporting a trend in their certainty that does not match real progress. In order for the CMIP5 to be validated by observed correlation (AFTER their date composition) it will take another decade at least for thumbs up or down. Meanwhile Mann, Marotzke and others are making worldwide press blasts that it’s all over, the proof is in. Except the natural downward variability they now say is causing divergence from the models was not in the conversation when the models were created. The 1980-1998 rise was not considered to be boosted by natural variability.
If the AMO/PDO continues its current cycle this means there is a better than 25% chance that the hiatus will continue to 2020. In that case what will the IPCC report to the world? Western science told billions of poor Muslims, Hindus , Zulus and you-name-its that the West was responsible for their bad weather and that we would repay them. What will their reaction be when we tell them, after five reports and being all but certain, we are not so sure? What would your reaction be?
I’m wondering what is the difference between this post which seems to suggest that when constrained by observation that the top end of the model range for future warming look unrealistic/unlikely. And say the work of Lewis and Curry ( and others) which suggests when using observation data that TCR looks to be at the lower end of the range calculated from the model ensemble?
The binary world of believers and sceptics seems to be blurring.
Hi HR,
Firstly, the TCR estimates of Lewis et al are well within the IPCC AR5 assessed likely range of 1.0-2.5K. Second, remember that the Lewis et al estimates of TCR also use (simple) models and the forcing estimates derived from the GCMs – they are not simply based on the observations.
The point made in this post by Richard is about the future rate of change, which is necessarily lower when constrained by observations because of the recent slowdown.
And, finally, there has never been a binary world – there has always been a continuous spectrum of views.
cheers,
Ed.
“And, finally, there has never been a binary world – there has always been a continuous spectrum of views.”
I’m sure you are correct when it comes to the community of scientists in the multi-disciplinary fields of climatology/meteorology however that cannot be said of the extreme polarisation that is evident in the media and in the politics of how the “subject” is presented to the public and even how it’s taught in the curriculum in schools.
As coming from a strong background in the physical sciences before crossing over to the social sciences, big mistake but it was the sixties, I find it really perplexing!
Thanks for a science site that really is a breath of fresh air.
Clive Best: “I don’t think it really matters whether current warming is 0.04C or 0.1C/decade. The evidence is that between AR4 and AR5 very little surface warming actually occured. This is a big deal whichever way you look at it. Despite this pause … ” [and so on]
Newer more reliable estimates of surface warming from Cowtan and Way and Berkeley Earth falsify the IPCC AR5 definition of the “hiatus”, which was explicitly defined as a warming trend in 1998-2012 less than half of the trend from 1951. In fact, C&W and BEST show indistinguishable trends from 1951 and 1998. The term “pause” is of course even more problematic.
This more complete understanding of long-term *and* recent surface temperature evolution does have implications for model-observation comparisons and climate sensitivity estimates.
For example, Lewis & Curry TCR and ECS estimates are increased by ~10% if one uses Cowtan and Way instead of HadCrut4 data set.
https://deepclimate.files.wordpress.com/2015/03/global-temp-annual-1998-20121.jpg