Category Archives: temperature

What does ‘mean’ actually mean?

Are you a user of global temperature data? If so, have you ever thought about the meaning of the word “mean” in “global mean surface temperature”?

I’m guessing that for most people the answer to the second question is “no”. “Mean” is such a ubiquitous concept that we don’t think about it much. But let me try and persuade you that it might need a little more thought. Continue reading What does ‘mean’ actually mean?

Warming stripes

LonglistClimate change is a complex global issue, requiring simple communication about its effects at the local scale. This set of visualisations highlight how we have witnessed temperatures change across the globe over the past century or more. The colour of each stripe represents the temperature of a single year, ordered from the earliest available data at each location to now. All other superfluous information is removed so that the changes in temperature are seen simply and undeniably.

Annual global temperatures from 1850-2017

The colour scale represents the change in global temperatures covering 1.35°C [data]
Continue reading Warming stripes

Linking global temperature and Arctic sea ice changes

As the annual September sea ice minimum in the Arctic approaches, the usual questions arise about whether this year will set a new record for the extent or volume of ice left at the end of the summer. Although there was a new winter record low in 2017 it is looking unlikely that the summer will also set a record for extent, but there is still a month to go.

We understand that sea ice melt is erratic – we should not expect new records every year, but the overall trend is towards less and less ice. But, what about looking further ahead? And, can we understand sea ice variations during the historical period? Continue reading Linking global temperature and Arctic sea ice changes

Rapid increase in heat extremes in Europe

In the last few decades, Europe has warmed not only faster than the global average, but also faster than expected from anthropogenic greenhouse gas increases (van Oldenborgh et al., 2009). With the warming, Europe experienced record-breaking heat waves and extreme temperatures, such as the 2003 European heatwave, 2010 Russian heatwave, and 2015 European heatwave, which imposed disastrous impacts on individuals and society. Continue reading Rapid increase in heat extremes in Europe

Global temperature change as polka-dots

Inspired by National Geographic’s climate change evidence graphics, I made my own global temperature polka-dot visualisations.

In the spirit of experimentation, here are three types, successively getting more complicated. After comments from several people I have made both portrait & landscape versions. I would be interested to know which works best for you. Continue reading Global temperature change as polka-dots

Frost fairs and the Little Ice Age

The term ‘Little Ice Age’ refers to a period of cooler temperatures between around 1400 and 1850, although a range of dates are used. This climate feature has been inferred from various types of direct and indirect evidence, but it is still not clear how widespread these cooler temperatures were.

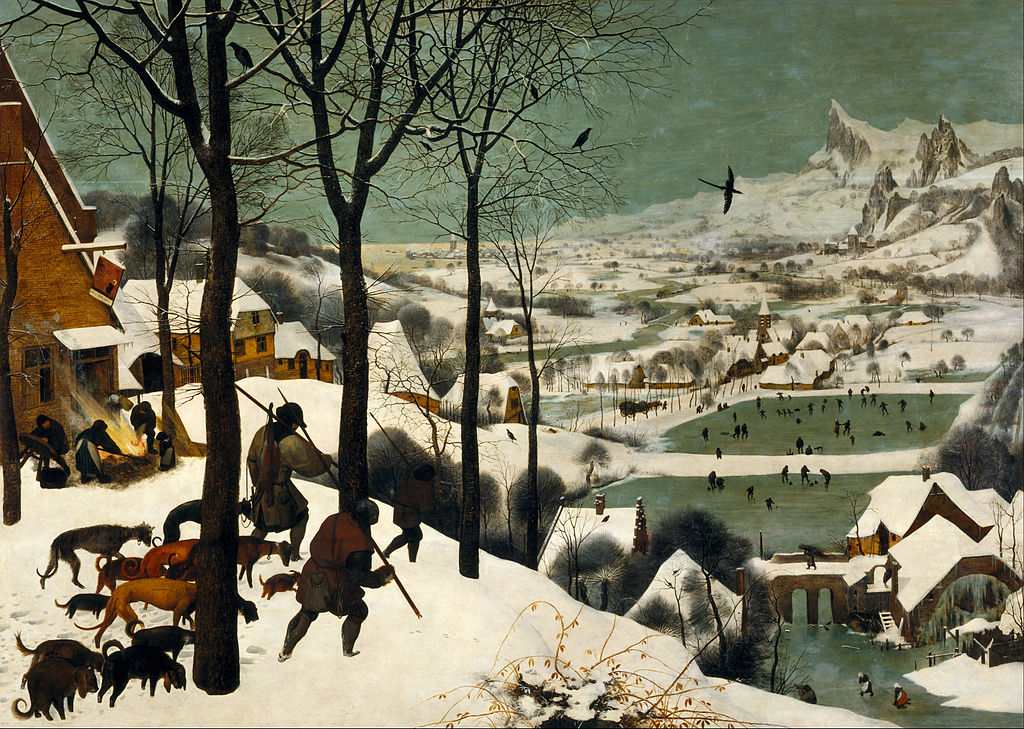
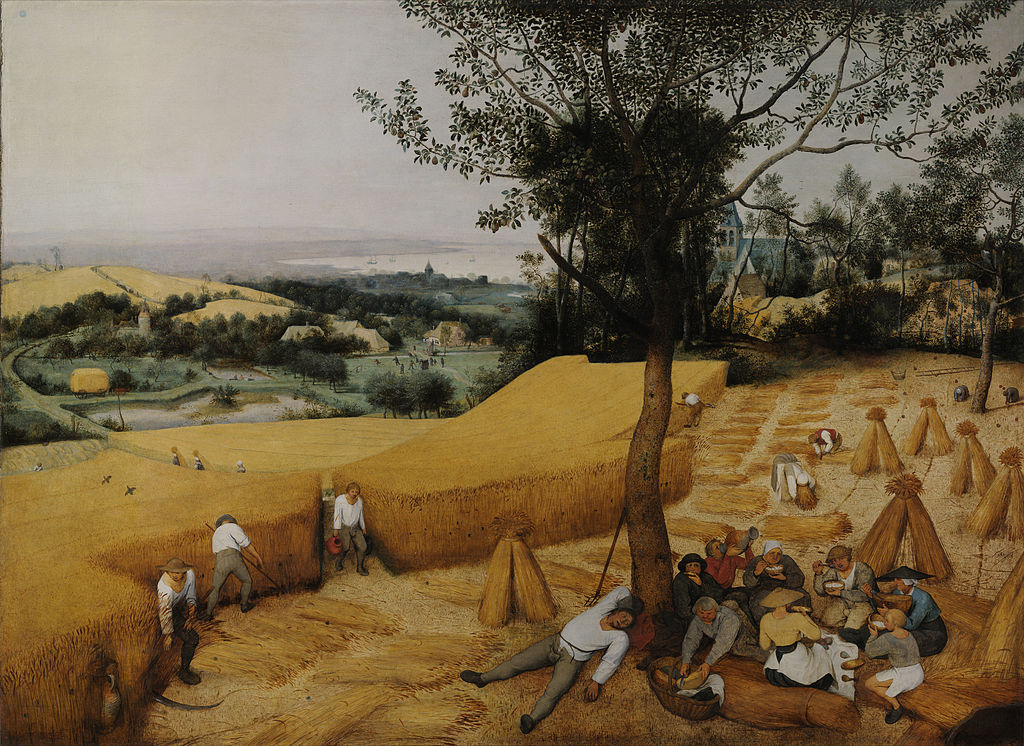
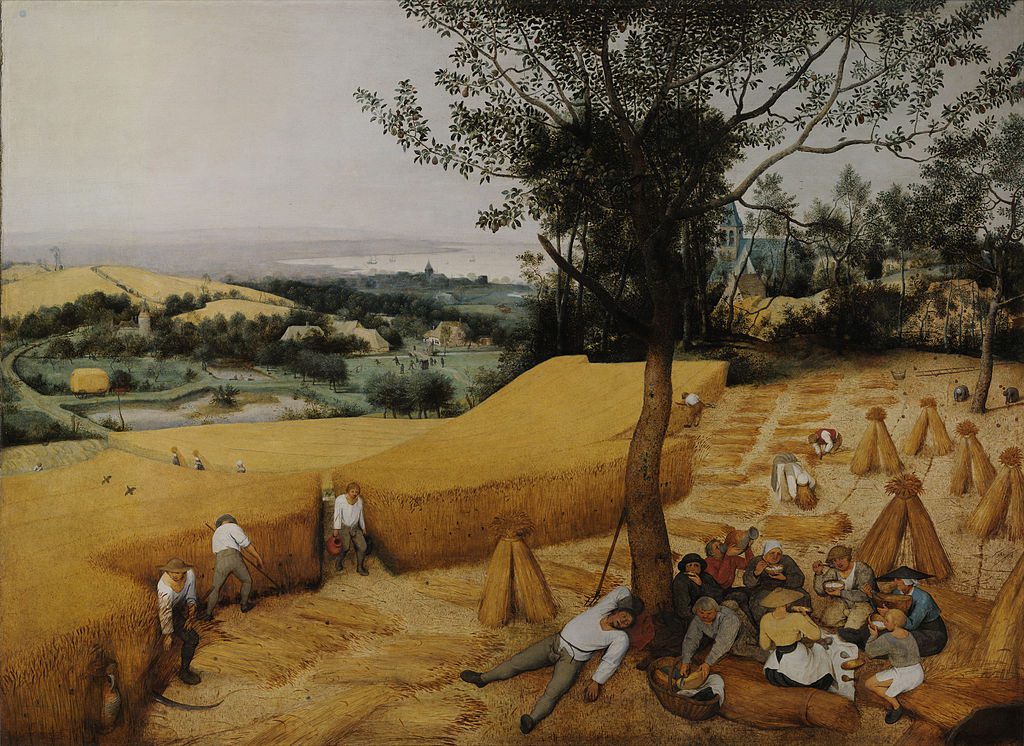
A new article by Lockwood et al explores some of the commonly used indirect evidence such as paintings and the occurrence of ‘frost fairs’ on the Thames. We also address the common assumption that the cooler temperatures were solely due to a reduction in solar activity (the Spörer and Maunder minima). Although this assumption is almost certainly wrong, the two features are sometimes considered to be synonymous.

Continue reading Frost fairs and the Little Ice Age