The temporary slowdown in global temperatures in the early-2000s is still prompting significant scientific discussion. A recent Commentary on the topic by Fyfe et al. was summarised in an earlier post. In response, a recent post by Rahmstorf et al. reiterates some of the statistical arguments that we discussed briefly in our Commentary1, but misses the main point.
Guest post by Fyfe et al.
Climate science, like all other areas of science, proceeds by challenging contemporary understanding – asking if new observations align with, or are at odds with our expectations. In the case of global mean surface temperature (GMST), our expectation (based on well-understood physics) is that increasing radiative forcing causes, on average, increasing GMST.
It is only ‘on average’ because we also understand that there are various sources of variability superimposed on the slowly evolving forced trend. While we expect variations around a background trend, the systematic and apparently growing difference (to about 2012) between the average of the model projections and the observed GMST (illustrated clearly in the IPCC 5th Assessment2 and in our Commentary) was of real scientific interest, and required explanation by the climate science community. Such explanation remains important.
The slowdown in GMST increase in the early 21st Century provides an opportunity to communicate basic concepts of signal and noise to a wide audience, and to affirm that the reality of a gradually evolving anthropogenic climate change signal is not challenged by decade-long natural fluctuations in climate.
Statistical analysis is a vital tool in any climate scientist’s toolbox. However, even the application of sophisticated statistical tools can shed more heat than light, particularly in arguments that focus on limited aspects of statistical significance rather than on broader physical understanding.
In their post, Rahmstorf et al. apply one particular statistical tool – change-point detection – to observed GMST time series. On the basis of their own work and similar studies, they argue that “there has been no significant change in the rate of global warming since ~1970”. Leaving aside the formal statistical significance (an issue we explore later), we note first that all of the temperature time series shown by Rahmstorf et al. exhibit a slowdown – that is, the warming rate between 2001 to 2014 is less than the warming rate from 1972 to 2001, regardless of the data set used or which method is employed to estimate slopes. (Even greater rates of slowdown occur for different choices of end-years, such as 2001-2012, and there are arguments that this, not the record warm year of 2014, should demark the end of the slowdown.)
As discussed in our Commentary and in many dozens of peer-reviewed publications, we now have considerable physical understanding of the drivers of this slowdown, and of the reasons why most model simulations did not reproduce it.
Whether the recent slowdown is statistically significant or not depends on the details of the analysis: the data set, the analysis method, the start and end points, the baseline period used for comparison, and the stipulated significance threshold. We pointed out many of these issues in our Commentary.
While such sensitivities are of some interest, and have been explored in a number of different studies, the failure of one particular choice of analysis to yield a statistically significant slowdown does not mean (as Rahmstorf et al. imply) that the phenomenon is not real or is uninteresting. Indeed the scientific progress we briefly surveyed in our Commentary was motivated by the challenge to explain changes in the warming rate, not by their statistical significance. We also note that using datasets available at the time much of the literature was written, the slowdown was more prominent, and the importance of like-with-like comparisons of models and simulations is only just becoming apparent3.
To illustrate the limitations of a purely statistical focus, we show in more detail results that were referred to in our Commentary. The results are from a global climate model4 in which ten simulations were conducted with specified external forcing (in greenhouse gases, aerosols, volcanic effects, land use, stratospheric ozone and solar variations; the HIST ensemble). Another ten simulations were conducted with the same model and external forcing, but with sea surface temperature (SST) in the eastern tropical Pacific specified according to observations (the POGA-H ensemble). The ensemble means shown in Fig. 1a clearly illustrate the slowdown that results when eastern tropical Pacific SST is prescribed. The simulated slowdown is similar to that in two updated observational estimates of GMST5,6.
Following the statistical approach advocated by Rahmstorf et al., we show in Fig. 1b piecewise continuous linear approximations to the observational estimates, the ensemble mean HIST and POGA-H estimates, and the ten individual members of the POGA-H ensemble. In all observations and POGA-H realizations, the 2001-2012 warming rate is less than in the HIST ensemble mean (which is similar to the CMIP-5 multi-model ensemble). As discussed in our Commentary and elsewhere, this difference in warming rates is real, and has well-understood physical causes. The statistical results are inconsistent: two of the ten POGA-H ensemble members have 2001-2012 slopes that are statistically different from their 1972-2001 slopes. Eight of the realizations do not. These results illustrate the dangers of relying solely on a statistical test to tell us whether there is, or is not a physically-based change in warming rates.
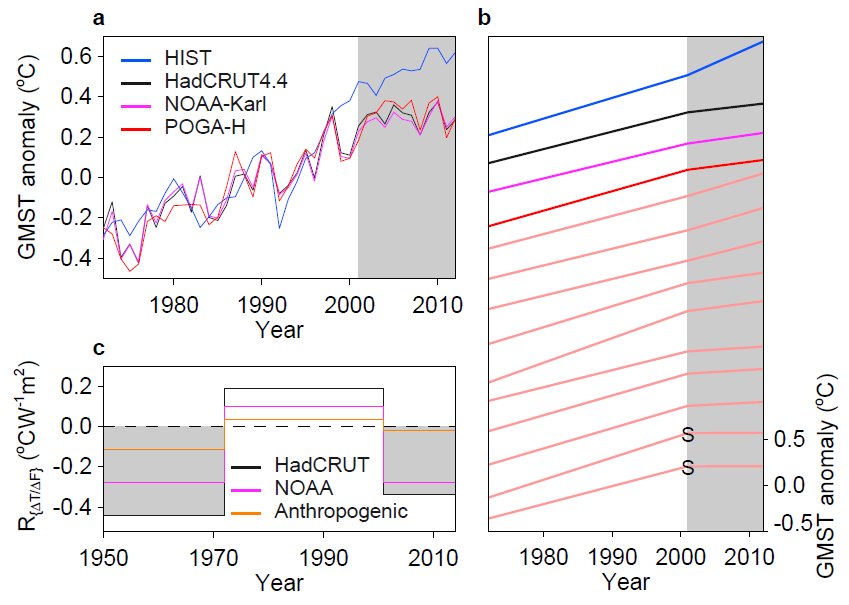
In this post we will also take the opportunity to update our interpretation of our R{ΔT/ΔF} diagnostic. This diagnostic was intended to illustrate more clearly the difference between our ‘expectation’ (the GMST change in response to external forcing) and observed GMST change over particular intervals. The choice of these intervals was physically motivated, and based on observed decadal variations in SST in the tropical Pacific. While we did not claim that temperature response should be instantaneous, it is true that the climate system has well-known time lags, potentially complicating our interpretation of R{ΔT/ΔF}.
Time lags in surface temperature response are accounted for in the results of an idealized energy balance climate model (EBM)7 shown in Fig. 1c. The EBM parameters were chosen to match the ensemble-mean forced response of the CMIP-5 models8. When driven by anthropogenic radiative forcing, the R{ΔT/ΔF} values computed from the EBM (which does not represent natural variability) are much smaller than the values we compute based on two estimates of observed GMST5,6. This is in line with what our original figure intended to illustrate: namely that the temperature anomalies from internal decadal variability and natural external forcing, when superimposed on the anthropogenically forced trend, are large enough (and persist long enough) to provide much of the explanation for the slowdown.
The bottom line is that global surface temperature experienced a warming slowdown over the early-2000s, and this slowdown was at odds with our expectation from most climate model simulations. Whether the slowdown was or was not statistically significant is, at least in our opinion, of relatively minor importance. The key point is that a measurable slowdown occurred, and as a result, considerable scientific progress has been made in understanding modes of internal variability (for example, ref. 4) and natural external forcing (for example, ref. 9), and how both modulate a changing climate. Dwelling on statistical details of trend differences does not further that understanding, nor does it contribute to effective communication of the role that internal variability plays in public perception of global warming – or of the well-founded attribution of ongoing global warming to anthropogenic forcing.
John C. Fyfe1, Gerald A. Meehl2, Matthew H. England3, Michael E. Mann4, Benjamin D. Santer5, Gregory M. Flato1, Ed Hawkins6, Nathan P. Gillett1, Shang-Ping Xie7, Yu Kosaka8, Neil C. Swart1 & Kyle Armour9
1Canadian Centre for Climate Modelling and Analysis, Environment and Climate Change Canada, University of Victoria, Victoria, British Columbia, V8W 2Y2, Canada, 2National Center for Atmospheric Research, Boulder, Colorado 80307, USA, 3ARC Centre of Excellence for Climate System Science, University of New South Wales, New South Wales 2052, Australia, 4Department of Meteorology and Earth and Environmental Systems Institute, Pennsylvania State University, University Park, PA, USA, 5Program for Climate Model Diagnosis and Intercomparison (PCMDI), Lawrence Livermore National Laboratory, Livermore, California 94550, USA, 6National Centre for Atmospheric Science, Department of Meteorology, University of Reading, Reading RG6 6BB, UK, 7Scripps Institution of Oceanography, University of California San Diego, 9500 Gilman Drive MC 0206, La Jolla, California 92093, USA, 8Research Center for Advanced Science and Technology, University of Tokyo, 4-6-1 Komaba, Meguro-ku, Tokyo 153-8904, Japan, 9School of Oceanography and Department of Atmospheric Sciences, University of Washington, Seattle, WA, 98195
References
1. Fyfe, J. C. et al. Nature Clim. Change 6, 224-228 (2016).
2. Flato, et al. Evaluation of Climate Models. In: Climate Change 2013: The Physical Science Basis. Contribution of Working Group I to the Fifth Assessment Report of the Intergovernmental Panel on Climate Change [Stocker, T.F., D. Qin, G.-K. Plattner, M. Tignor, S.K. Allen, J. Boschung, A. Nauels, Y. Xia, V. Bex and P.M. Midgley (eds.)]. Cambridge University Press, Cambridge, United Kingdom and New York, NY, USA.
3. Cowtan et al. Geophys. Res. Lett. 42, 6526 (2015).
4. Kosaka, Y. & Xie, S.-P. Nature 501, 403-407 (2013).
5. Morice, C. P., Kennedy, J. J., Rayner, N.A. & Jones, P. D. J. Geophys. Res. 117, (2012).
6. Karl, T. R., et al. Science (2015).
7. Held, I. M. et al. J. Climate 23, 2418-2427 (2010).
8. Geoffroy, O. et al. J. Climate 26, 1859-1876 (2013).
9. Santer et al. Nature Geosci. 7, 185-189 (2014).
“Leaving aside the formal statistical significance (an issue we explore later), we note first that all of the temperature time series shown by Rahmstorf et al. exhibit a slowdown – that is, the warming rate between 2001 to 2014 is less than the warming rate from 1972 to 2001, regardless of the data set used or which method is employed to estimate slopes.”
In my opinion, this is not a good approach to statistical analysis. I work in machine learning, and if I wrote a paper in which I said “Leaving aside formal statistical significance, my method outperforms the competing methods”, I’d expect to have a hard time from the anonymous reviewers, and quite rightly so (especially if the significance test left me unable to reject H0).
We all know that Null Hypothesis Statistical Tests (NHSTs) have their problems, but if it has one real benefit it is that it enforces a degree of self-skepticism on the researcher so they are appropriately circumspect in the claims that they make. The basic idea is that we set up hurdle (usually little more than a sanity check) and don’t promulgate strong conclusions unless the effect size is sufficiently large that it is unlikely to be observed if it arose by random chance. Unless there is statistically significant evidence for a break-point, nobody should be claiming that there unequivocally has been a “slowdown” as it has not been demonstrated that it is unlikely that the rate of warming has remained the same and what we observe is the result of random chance. A better phrase would be the “apparent slowdown”. I have to say I don’t really understand the reluctance to moderate the language used on this particular question.
As someone who claims to be familiar with statistical practice, you should know the first rule of statistics: If you have a talking dog, you don’t need statistics. And so, if you look at the graphed data and see an obvious change in rate by a simple eyeball test, any dispute of the obvious can only be of the ‘who are you gonna believe, baby, me or your lyin’ eyes?’ category.
If subjective visual inspection were reliable, we wouldn’t need statistics. Unfortunately the human eye is all too good at seeing structure in data that isn’t really there. In this case, if you mask out the 1998 El-Nino, the apparent slowdown is much less obvious, which suggests the El-Nino spike is affecting our visual perception of the underlying structure of the data.
http://woodfortrees.org/graph/uah/from:1979/to:1997/plot/uah/from:1999
It may be obvious to you, but then again it seems that our beliefs about what the data mean can have a quite strong affect on what we see in it (see http://www.sciencedirect.com/science/article/pii/S0959378016300577). Statistics does not share that property.
I have to say I don’t really understand the reluctance to moderate the language used on this particular question.
I think I forgot to say on the previous thread, it strikes me that “slowdown” is amongst the most inappropriate terms which have been used. At least “hiatus” and “pause” implicitly transfer the idea of something which will start up again. “Slowdown” implies a permanent deceleration.
I prefer adopting what some oceanographers said about the 2010-11 sea level rise “hiatus”: “a pothole on the road to higher seas.”
Hi Dikran,
There has been much confusion over whether the test is about the observed rate of warming changing or whether the underlying rate of warming changed. These are very distinct questions and would be tested in different ways. Which do you refer to?
Ed.
I don’t think it is meaningful to talk of a change in the observed rate of warming without distinguishing what we would regard as noise and what we would regard as the underlying signal. If you take a signal that is all just noise, then you can always find periods with a positive “observed” trend and periods with a negative “observed” trend, but the change doesn’t actually mean anything, its all just noise. Have we learned anything from pointing it out; does it mean that there is anything to explain?
If we take *any* two periods and compute their trends (their observed rates of warming) they are almost always going to be different (i.e. there will be *some* change). For example UAH from 1979-1994 is has a slightly negative trend and 1994 to present has a slightly positive trend.
http://woodfortrees.org/plot/uah/plot/uah/to:1994/trend/plot/uah/from:1994/trend
But does it mean anything? Would it be correct for me to talk of the “speedup” that occurred in 1994? I’d say not, at least not without the circumspection of “apparent speedup” to indicate that it isn’t necessarily meaningful.
In my view, what we should be asking is whether the apparent slowdown is due to a change in the forced response of the climate system or whether it is an artifact of the unforced response of the climate system. This is especially the case if we are considering what we would expect from the models as the ensemble mean is essentially an estimate of only the forced response, so we don’t expect the observed trend (which also has an unforced component) to lie any closer the ensemble mean than that of a randomly selected ensemble member.
Hi Dikran,
We are asking exactly the question you describe – how has the entire observed evolution of temperatures (and other aspects of the climate system) depended on changes in radiative forcing, and what is caused by variability. Also, it is not just global temperatures which have shown interesting features – the wind changes in the Pacific have been outside of our expectations, even given the ensemble of simulations – and by identifying these differences we can learn about the dynamics of the climate system.
Ed.
Sorry you are ignoring the point I am making, which is that your use of language is deeply misleading. As I said, I don’t really understand the reluctance to moderate the use of language, it seems to me to be a recipe for “talking past” those that disagree with you (and obfuscating the discussion of forced-vs-unforced response). All that is required is the use of “apparent slowdown” rather than just “slowdown” to make it clear that you are talking about the appearance of the observations, rather than necessarily their substance.
It is interesting to note that the discussion is always of the “slowdown” around 2000, rather than the “speedup” of 1994, even though the apparent evidence for both of them is approximately comparable.
Hi Dikran,
Our Commentary discusses at some length the language used in the scientific literature and fully accepts that it has been sub-optimal – my preference is temporary slowdown. But, please note that the main issue is the comparison with the models, not the magnitude of the observed trend itself. The pre-1998 period is well within our expectations as derived from the simulations, whereas the post-2005 period was on the edge of expectations, especially in the older observational datasets used when much of the literature was written. It is this difference which prompted the analysis of this period – not the magnitude of the trend per se.
Ed.
Dikran,
Taking the cooling from the Pinatubo eruption into account no speedup occurred in 1994.
see f.e: http://www.nature.com/ngeo/journal/v7/n3/fig_tab/ngeo2098_F1.html
John, yes (note Pinatubo erupted in 1991, so it doesn’t explain all of the flat trend from 1979), I know, the point is why don’t we talk about the 1994 “speedup” as much as we talk about the 2000 “slowdown” (“seepage”)?
Ed, I have seen the main message of the post, but disregarding statistical tests for a change in the rate of warming and then asserting there has been a slowdown without any qualification (as this article does) remains misleading, and wouldn’t be acceptable in other fields of science. I still don’t understand the reluctance to moderate the use of language to find something that we can all agree on, especially since both “sides” are interested in the same question (and AFAICS reach similar conclusions).
Hi Dikran,
I have given my preferred terminology which emphasises the temporary nature of the fluctuation which I like. There is a diversity of opinions on what this event should be called, partly due to certain words meaning slightly different things to different people, especially in different languages. And, there is literature on the ‘speedup’, but it has not received so much study because the rate of change fits with our expectations so requires less explanation, by definition.
cheers,
Ed.
I should point out that the evidence for a change-point failing to reach statistical significance does not mean that there is no change-point (just that we can’t claim there *has* been a change without qualification), so there is plenty of scope for over-confidence in both directions.
“These results illustrate the dangers of relying solely on a statistical test to tell us whether there is, or is not a physically-based change in warming rates.”
I don’t think we should rely on statistical analyses for this, especially as statistics cannot unequivocally determine causal (rather than statistical) relationships. To determine whether there is a physical cause behind what we see in the observations you really need the physics. However, statistical tests can be useful in understanding the observations and exploring possible physical relationships, and most importantly imposing self-skepticism and appropriate circumspection.
I think he’s soaking up your time Ed.
Fyfe et al. claimed: “the surface warming from 2001 to 2014 is significantly smaller than the baseline warming rate.”
This significance claim was not support by statistical analysis. We (two professional statisticians and myself) performed this analysis and found no significance.
Now your response to this basically is: (a) this “depends on the details of the analysis” and (b) it is “of minor importance” anyway.
The latter reads like an admission that indeed it isn’t significant – or would you have argued that statistical significance is “of minor importance” had you found a statistically significant slowdown?
The former claim that “it depends” could have been easily demonstrated by you with a single example of an analysis where you do find statistical significance. Our blog post as well as at least three published studies (Cahill et al. 2015, Foster and Abraham 2015 and Rajaratnam et al. 2015) have thoroughly investigated the significance question with all kinds of methods, data sets and for all time periods. They find no significant slowdown, no matter how you analyse it (strangely none of these were cited by Fyfe et al., even though the paper contains – without my consent – an acknowledgement of discussions with me, which had precisely revolved around the lack of statistical significance in the change point analysis). My conclusion is that the claim that “it depends” is thus wrong.
Hi Stefan,
Thanks for commenting. Below is the situation that we faced when drafting the AR5 report in early 2012:
http://www.met.reading.ac.uk/~ed/situation_2012.png
We had had 10 consecutive years below the multi-model CMIP5 average and the 2001-2011 trend was (just) negative in HadCRUT3. Faced with this situation, we needed to assess whether the CMIP5 range was reliable for the next ~20 years in Chapter 11 of AR5. This is the reason why I (and I suspect many others) have considered this topic at length. Because of that we have learnt a great deal about climate variability, the role of various forcings, and how to better compare models and observations. For me, the statistical significance of these short term trends is a bit of a red herring – we had to understand the physical reasons for the difference between the observed temperatures and the simulations. We now have a much better understanding of this. But, the communication between scientists, and to the public, of these subtleties has not been good.
cheers,
Ed.
Dear Ed – nobody has ever doubted that it has been scientifically fruitful to look at these issues, and as you know I have published several papers on this myself. Of course it is interesting, and I am surprised that you claim that our blog piece implies otherwise. (We asked you specifically, before you published this, to comment on what we actually say and not on what you think we “imply”, and we have specifically told you that we do not imply any such thing.)
The key question here is: was it justified to give the message out to the public that global warming has slowed down? I don’t think there ever was a sound scientific basis for this. And look at the impact that claim has had in the media.
If statistical significance is a red herring: why don’t you just concede this point and agree that there was no statistically significant slowdown? Then that point would be settled. Scientists should be able to settle on the answer to such a simple and clear-cut question, and then we can move on to discuss other topics like the physics of natural variability.
Dear Ed,
I sometimes wonder whether you perhaps may not be seeing the wood for the trees, so perhaps it might be helpful to take a step back and look at this from some distance. Let us look at a hypothetical case from another field of science. Let’s take medical science – it is similarly relevant for public well-being.
Imagine a medical researcher who publishes a discussion of breast cancer treatment in a prominent journal. He concludes that treatment B significantly reduces the risk of death as compared to treatment A. Media around the world report this. Millions of women consider changing their treatment.
But there is one problem: the article does not provide any statistical evidence for treatment B being more effective. What is more, it fails to mention several published articles in which other groups of researchers have concluded that medical trial data do not show any evidence for statistically significant benefits of treatment B.
When confronted with this, the medical researcher claims that “statistical tools can shed more heat than light”; that statistical significance is “of minor importance”; and that whether the difference between treatments A and B “is statistically significant or not depends on the details of the analysis”.
He fails to provide evidence for the latter claim and given the published evidence, it appears to be false. The published statistical analysis have shown the opposite: for none of the various medical trial data were statistically significant benefits of treatment B found, regardless of the various methods applied. The researcher must have known this.
When confronted with this, the medical researcher still does not produce any statistical evidence for the benefits of treatment B but responds that statistical significance for him “is a bit of a red herring”.
What would you think of such a medical scientist?
Please come clean. Either present a statistical analysis that demonstrates the significance of the alleged slowdown. Then we can discuss the merits of this analysis, as scientists should. Or if you can’t back it up with evidence, take back your claim that “the surface warming from 2001 to 2014 is significantly smaller than the baseline warming rate.”
Let us settle on the facts that can be established by the scientific method. We can then still disagree about their interpretation, e.g. whether statistical significance matters or is a red herring. The public can then judge which interpretation is more credible.
Hi Stefan,
Here is a figure that was originally in the Fyfe et al. paper but was removed during the review process. It shows various linear trends (and error bars, 10-90% ranges) for the HadCRUT4.4 and Karl et al. datasets:
Figure
For example, the trend ranges for 1972-2001 and 2001-2014 are significantly different from eachother, especially for HadCRUT4.4. This is the basis for the statistically significant statement in the text. The error ranges account for the serial correlation, following Santer et al (2000). If you want more details then ask John Fyfe who did the calculations.
cheers,
Ed.
Stefan, Your parable is a bit of a strawman. Here’s an attempt to make it more representative: As you said, maybe there is no evidence that Treatment B changes the long-term trend/result (no decrease in risk of death, i.e., no change in the long-term AGW rate) but Treatment B was observed temporarily shrink tumors in recipients (even though they still died from the cancer). It clearly might be important to understand why/how the tumors shrank even though, for now, it has no impact on reducing risks. (To further the parable: some don’t want anyone to study the tumor shrinkage, or even mention it happened, for fear it will mislead patients/doctors to rely on the ineffective Treatment B.)
CS: but who would not want the tumor shrinkage studied? I do not know anyone like this. In the parable, I have studied it myself, and in my blog articles I have praised the investigations that the authors of Fyfe et al. have performed in this direction, e.g. to clarify the role of ENSO and IPO. But I do believe their claim of statistical significance of the slowdown is false. Scientific ethics requires them to either back it up with evidence, which can then be further discussed by statisticians, or to retract it. Making such claims without being prepared to answer collegial questions about the evidence is in my view not acceptable in such a matter of high public interest.
I thank Ed Hawkins for providing the evidence for the significance claim in their paper (i.e. the graph), and his co-authors for some offline follow-up discussion. I am happy to say that to me the scientific question about this claim is now resolved and settled. Fyfe et al’s claim of a “significant slowdown” is based on a common statistics pitfall: selection bias. I had suspected as much, as in 2013 I wrote a blog post (in German, http://scilogs.spektrum.de/klimalounge/erwaermungspause-von-storch/) about another, similar case like this (that paper apparently did not pass peer review).
Fyfe et al. simply computed the linear trend values for two time periods, a “baseline” and a “slowdown” period, and since the confidence intervals of the two trends do not overlap they call the difference “significant”. This sounds reasonable at first but is incorrect. The problem: the “slowdown period” is not a randomly selected sample, but it was chosen from many possible time periods because the trend is low.
In my blog post I use the analogy of rolling two dice many times. At some point the dice show two ones. You think “Wow, what a low number, I wonder how unlikely this is! Must be significant!” (“Significant” in statistics usually means that something is unlikely to have happened just by random chance – 95% significance means there is only a 5% probability of a result occurring purely by chance, i.e. a 95% probability that there is more to it than chance.) Indeed, the probability of rolling such a low number as sum of two dice is only 3%. However, the probability of rolling two ones if you get to try twenty times is of course far higher, and there is nothing special or significant if you do.
Likewise, you can look at the baseline trend and baseline variability during 1972-2000 and ask: if this continues completely unchanged – same trend and same random variability – how likely is it that you would at some point find a trend as low as in the “slowdown period”, entirely by chance, with nothing more to it? For the GISS data, the trend during Fyfe’s “slowdown period” 2001-2014 is 0.07 degrees C per decade, and the chances that somewhere in the time period 1972-2014 (43 years) a 14-year interval with such a low trend would occur are 77% (as Monte Carlo simulations show)! So the fact that such a “slowdown” period would occur, just by chance, is not at all surprising. It is to be expected!
Yet much of the public slowdown debate has revolved around this low trend supposedly being surprising, calling for an explanation, even calling global warming into question etc.
Even for the HadCRUT data (questionable due to missing the Arctic), this probability is 23% and thus far from significant. And that despite several post-hoc choices have been made that bias the trial in favor of significance: the number 14, as in 14-year period, was also cherry-picked after the fact because that was the duration of the observed slowdown period, and the 43-year observation interval was likewise chosen after the fact, namely until we observed a slowdown period and started discussing it, rather than preselected.
I discussed this with Fyfe and co-authors and they had no counter-arguments. Rather, they kept coming back to correlations with Pacific winds etc. All fine – but not my point. Sure there are physical mechanisms like ENSO behind that observed internal variability. But if you just observe what is happening to global temperature, there is nothing special or significant about the low trend during 2001-2014 – it is entirely within the expected random variations in trend based on what we had already observed in the baseline period 1972-2000.
The public, however, was given the false impression that something weird and unexpected was happening to global temperature. As we have argued many times over the years over at Realclimate, as several studies have shown, and as is also confirmed by the recent record hot temperatures, that simply was not the case. I hope that the authors of Fyfe et al. will join me in countering this public misperception, because it has consequences.
A natural deviation is usually not statistically significant in the noise of natural variations. However, the physical causes behind natural variations are well worth studying. An understanding of the natural climate variations makes it much easier to discern the man-made climate changes…
“A natural deviation is usually not statistically significant in the noise of natural variations.”
Well, to determine that, you need an accurate model for what the natural variations will be.
In large part, that’s what this is about: our understanding of the internal natural variability of the Earth’s climate over interdecadal timespans.
I had watched the “pause” through 2013, but I also began to recognize that it wasn’t particularly significant by constructing this chart:
http://climatewatcher.webs.com/TCR.png
While there was a nearly flat trend from 2001 through 2013, this trend still obeyed the longer term relationship.
If the physics is “well understood” as you claim, why all the hand wringing? Let’s put money for scientific research into something that might actually help humanity. “Settled science” does not need multi millions of dollars in research grants unless, of course, the main purpose is to keep people employed. Climate scientists have enjoyed a pretty good run, but now that they have “proven” that CO2 will be the downfall of the earth, they should all move on to something else which might benefit our precious remaining years, decades, centuries, millennia, or whatever.
1. That increasing levels of CO2 in the atmosphere will warm the planet is settled science.
2. Exactly how much warming we will see in future, and how rainfall patterns will change, etc, is not yet settled. These are the important questions which still need answering if we are to adapt to what is coming.
Ed.
How much has 400 ppm of CO2 warmed the earth? How much will 500 ppm warm the earth? How much will 800 ppm warm the earth? It should take 5 seconds to answer those questions if the effects of CO2 are settled science.
The IPCC report has those answers, presented as a range.
Ed.
The problem with the ensembles that the IPCC uses to define the range of projections is that the estimates have not converged for over a decade.
Modelers do not agree on parameters for cloud and aerosol effects and water vapour feedbacks. The uncertainties concerning clouds and aerosols implies uncertainty in the albedo parameter and thus incoming short wave radiation.
In my opinion, the failure of models to converge means that, while the models are useful for experimentation, their projections should not be considered forecasts appropriate for informing policy.
Failure to converge also implies that not enough is known enough about climate sensitivity to CO2 to enable us to partition climate change into internal variability and exogenous drivers of the climate system.
Hubert Lamb’s advice is still relevant: Greater research efforts are needed to support watchful waiting, but no action should be taken.
This sounds to me much like the advice of Hippocrates: Do no harm.
I strongly disagree – the models have converged to the extent that the feedbacks are positive and that even the least sensitive model produces impacts that we would want to avoid if possible. The right framework, in my view, is one of risk: if faced with multiple lines of evidence suggesting considerable risks without reduction of GHG emissions, it does not seem prudent to do nothing!
Ed.
the models have converged to the extent that the feedbacks are positive
Hmmm….
Since the observed warming rate is greater than that suggested by Planck response alone, positive feedback appears consistent, though if one treats ocean heat as Peilke suggests – lost to the climate system – then the feedbacks are about 50%, not 100%.
However, Soden and Held 2006 indicate the largest positive feedback as water vapour and the largest negative feedback lapse rate.
But the ‘Hot Spot’ has not occurred, at least not in the satellite era – a big divergence. The Hot Spot is the source of the negative ‘Lapse Rate Feedback’. One can spin that fact a lot of ways ( when it does occur, warming will be less, or, it won’t ever occur and we’ll warm without any brakes ), but it’s a divergence and also likely has an impact on water vapor, because the lack of modeled warming there means also a lack of water vapor feedback there ( more than half the earth ).
and that even the least sensitive model produces impacts that we would want to avoid if possible.
Specifically? Top Three? Most impacts appear speculative, exaggerated, or both.
A 1 meter rise in sea level today would be catastrophic. A 1 meter rise in sea level over the next 300 years would be irrelevant ( at least for now, no one lives 300 years, but if they did, they wouldn’t want to be in 300 year old buildings anyway ).
And we are carbon based life forms, after all, every cell of which are alive only because of the photosynthesis of atmospheric carbon dioxide.
And we did all evolve in tropical Africa.
And human acclimatization time to temperature is about two weeks, according to heat stress models.
And human mortality does peak during the cold season and trough during the warm season.
And, and, and…
it does not seem prudent to do nothing!
If you look at Hansen’s 1988 testimony, and start at 1979, observations are all of trends less than his Scenario C. Scenario C, one will recall, is the one in which emissions of CO2 completely stopped in 2000. Since temperatures are lower than this, we can say ‘Doing Nothing’ was actually more effective than ‘Doing Everything’ ( completely ceasing emissions ).
We should also reflect that ‘Doing Nothing’ includes the fact that 5 of the top 6 emitting regions ( Europe, US, Russia, Japan, and now China ) have declining, not increasing CO2 emissions. This points to the big irony with the IPCC. The IPCC was founded with consultation of the ‘Club of Rome’ and the Paul Ehrlichs of the world. Ehrlich warned of population bombing, just as fertility was falling. It’s pretty clear that declining population, which is at the heart of not just CO2 but all environmental footprint, is inevitable – and the result of economic development!. Economically development of the remaining world will do more to reduce co2, why? Because fertility is strongly anti-correlated with economic development and also economic development coincides with increased efficiency.
Doing nothing also means the more or less flat CO2 emissions since 2013. Total GHG RF annual rates peaked a few decades ago, it appears that CO2 RF rates may also have already peaked. These are due to secular changes – part of doing nothing.
I have a fundamental problem with equating CO2 radiative forcing to solar radiative forcing.
The former is high entropy radiation while the later is low entropy. This loss in entropy is what drives the earth’s climate and maintains all life on earth. CO2 changes the escape to space of ‘waste’ heat, mainly at night and during winter at high latitudes. There are other differences:
1. Solar cycle variability is small during a solar cycle but the increase is in high energy photons (UV). These photons reduce entropy.
2. Solar forcing peaks at midday. This drives convection and evaporation, transporting heat directly through the tropopause. This short-circuits CO2 radiative transfer It falls to zero at night
3. CO2 ‘forcing’ becomes important at night and in winter, especially in polar regions.
My question: Just how accurately do climate models really reflect this fundamental difference?
I am not a scientist, the earth is not a greenhouse, and the science is not settled on the effect of CO2 levels on global temps. The physics are barely understood in my opinion.
Dave, I’d recommend getting educated on the science and the physics.
There are some great textbooks available online. Ray Pierrehumbert’s book “Principles of Planetary Climate” is a wonderful introductory textbook on the subject, and can be found for free online. It covers a lot of ground, and needs barely any math beyond a little introductory calculus.
Hello Ed.
1. That increasing levels of CO2 in the atmosphere will warm the planet is settled science.
Yes, it’s certainly calculable by accepted radiative codes.
2. Exactly how much warming we will see in future, and how rainfall patterns will change, etc, is not yet settled. These are the important questions which still need answering if we are to adapt to what is coming.
You may ( or may not ) be interested at this look I took at RF changes for glacial cycles in comparison to PreIndustrial, Recent, and a CO2 Double scenario. A big caveat upfront is that there are a number of assumptions.
Still I think it’s relevant. The largest two features ( apparent from maps of precipitation annual means ) with respect to the general circulation are the jet streams and the ITCZ. If the gradients of net radiance ( ->temperature->pressure ) account for jet stream intensity and if Northern – Southern hemispheric gradients are representative of ITCZ wanderings, then the glacial cycles radiance accounts well for the dry LGM and wet Eemian and Holocene. Such gradients also reveal little change associated with a CO2 doubling. That would change were sea ice to vanish completely as opposed to the 10% reduction used in the scenarios.
See Global Warming in the Context of Glacial Cycles
Climate science does not operate in vacuum insulated from the worlds of policy and politics. How climate scientists frame their work when publishing, and their particular choice of words, has significant impact on the degree of urgency conveyed to policymakers. It is irresponsible in the extreme to ignore that impact.
Justifying the communication of “slowdown” language by arguing it “provides an opportunity to communicate basic concepts of signal and noise to a wide audience,” is an example of irresponsible science communication. The media is NOT the appropriate venue to teach Americans about signal/noise concepts, especially when such an effort runs a huge risk of fueling the misconception that global warming has slowed down.
It terms of climate science communications, this was an own goal.
Hunter Cutting, I don’t think that the use of the word “slowdown” was an own goal for SCIENCE. As one can see clearly in Fig.1a of the post there was (is) a discrepancy during the “slowdown” and it’s real: The observed GMST don’t follow the expectations of models. This is a fact that should be investigated IMO. The argumentation of good or bad communication fails the target, because for a scientist the first order question should be: What’s the bottom line of our understanding of the system “earth climate”? NOT: how to communicate our results. The difference between science and PR is huge, IMO. The paper in question was published in an scientific journal: Nature Geosience and NOT in a PR-journal “How to communicate Climate change for urgent action”. The same direction follows this comment by Greg Forster at his blog: “A statement like “Whether the slowdown was or was not statistically significant is … of relatively minor importance” makes me think they need more appreciation of statistics. Especially since the term “slowdown” is so loaded.” https://tamino.wordpress.com/2016/05/21/record-global-warming-or-warming-slowdown/?replytocom=95229#respond
This is IMO a highlight: The first part is rude ( “they need more appreciations…”) and the second part shows the difference of some scientists to science and the proximity to PR because the worry of using a “loaded word”
I would point you to the authors’ own words to describe their purpose for writing up their science as they did:
“The slowdown in GMST increase in the early 21st Century provides an opportunity to communicate basic concepts of signal and noise to a wide audience,…”
The authors are very upfront about public communication being a key goal of their work. Of course, they ended up an own-goal, as born out by the public fall-out over this journal article, which quite frankly could have been foreseen by most any communication expert.
And, quite frankly, it should have been foreseen by the authors, especially given the huge own-goal scored by the IPCC AR5 WG1 over this EXACT same issue.
For those not versed in the public communications of the science regarding the faux pause: the IPCC WG1 SPM final draft for governments included new language on the faux pause NOT seen in earlier drafts. That language was extremely poorly constructed. That SPM draft was leaked prior to the final plenary editing session, but the IPCC authors refused to talk to reporters (because it was supposed to be a private document), and the result was a spate of “global warming slowdown” articles, spearheaded by an Associated Press piece. In the event of the plenary which the followed, the SPM language was edited and clarified dramatically, but the communications damage had already been done.
First of all, I would like to express my respect and admiration for all of the researchers involved. I look up to a great many of you, and have had the good fortune to meet and even work with a few of you.
I would like to take issue with a few aspects of this response to the post on Open Mind.
– The Fyfe et al. authors write “the failure of one particular choice of analysis to yield a statistically significant slowdown does not mean (as Rahmstorf et al. imply) that the phenomenon is not real or is uninteresting”, This seems a little ungenerous and to be putting words in the mouth of Rahmstorf et al.
– This response seems to be a sort of “ends justify the means” explanation for claiming something that doesn’t appear to hold true statistically which completely sidesteps the primary issue raised by Rahmstorf et al. Were there interesting things happening with respect to the trade winds, tropical Pacific SSTs, moderate volcanism, etc. during this time? Sure. But there are interesting things happening with radiative forcings and internal variability throughout the instrumental record. The Fyfe et al. authors seem to think that one must be dismissive of these phenomena if one is arguing against the existence of a “hiatus” or “lack of warming”, and I would point out that this is in principle absolutely not true.
– This entire line of argument has become hopelessly confounded by the conflation of whether or not there was a cessation of warming with how well models and observations agreed over the period in question. Fyfe et al. make the argument that the latter is the real meaning of “hiatus” but this not only ignores the plain English meaning of the word, it completely ignores the history of the claim that warming had stopped. The original claims of a lack of warming/cooling/a “pause”/”hiatus” go back to contrarian claims from the mid-2000s which were essentially just cherrypicking the outsized impact of the 1998 El Niñio event to claim subsequent cooling/lack of warming. These contrarian claims were addressed at first in science blogs and eventually spread to the actual peer reviewed literature. The claims about warming stopping or dramatically slowing down were not made in relation to the envelope of available modeling runs. In fact, climate models were introduced into the discussion by scientists to explain that warming was not expected to be monotonic going forward. It was only over time that the ideas of a lack of warming and a model-observation divergence became conflated. I would argue that this was a product of “seepage” from contrarian claims into the scientific literature, and I believe that a careful review of media and scientific papers of the time bear this out.
This last point is a rather long-winded way of saying this:
If the Fyfe et al. authors did not conflate a model-observation divergence with a “hiatus”/”slowdown”/”lack of warming”, there would be nothing contradictory about their discussion of internal variability and forcings on the surface temperature evolution of the the time period in question vs. the repeated demonstrations that there has been no statistically detectable change in the underlying warming rate. Yet the Fyfe et al. authors seem to somehow place blame on the Rahmstorf et al. authors for continuing to correctly point out that it’s really not justifiable to say there was any such slowdown in any sort of meaningful sense.
It is entirely possible to believe that a lot of good work came out of examining the post-1998 period while also believing that claims of a “hiatus” in the scientific literature were influenced by contrarian attacks, were premature, and are ultimately unjustified.
Respectfully,
Peter Jacobs
Imagine you drive along in your car at a steady 50 km/h. Then you press down the gas pedal. Nothing happens. The car keeps going at the same speed. You turn to your wife and say: “Gee, the car has slowed down!”
Is that what Ed Hawkins or John Fyfe really would say? Or is the redefinition of “slowdown” as a discrepancy with model expectation just a way to salvage the slowdown narrative when it has been demonstrated that there never was a real slowdown in the usual sense of the word?
On the alleged discrepancy with models there is not even agreement amongst the authors of Fyfe et al. Right after the publication of the paper, coauthor Mike Mann took to twitter to clarify: “2000s warming slowdown doesn’t imply model/data discrepancy.” https://twitter.com/MichaelEMann/status/702666900799553536?lang=en
In my opinion the first statistical error is to call the slope of the OLS regression on 15 years of data a “trend” of the underlying time series, especially without mentioning the uncertainty.
Repeating the calculation (for HadCRUT4.4 in the period 1998-2013) shows the “trend” per decade is 0.05 +- 0.12, and the correlation (whatever variation of the R^2 is used ) close to 0. Mostly noise and just a small signal. What the statistics are telling you:
there is only a very weak indication of a linear trend, and if you assume there is one, the slope is extremely uncertain
For GISS it is only a little bit better: 0.11 +- 0.11.
If you show a “running trend”, at least show the variation too.
Are you arguing passed each other?
In deterministic systems, the division of an output into signal and noise seems subjective. It might be clearer to distinguish between parts that are regular/understandable/explainable/predictable and those that aren’t.
Progress being represented by increase in the former category and the reduction in the later.
In the case of deterministic models, the output is just a representation of the input, it contains no information that wasn’t present in its prescription. It is just a working out.
The noise can be seen as a measure of ignorance. There maybe nothing random about it, a failure to understand or predict does not necessarily imply the existence of randomness.
You wrote:
“As discussed in our Commentary and elsewhere, this difference in warming rates is real, and has well-understood physical causes”
So it isn’t a mystery, but nor I think was it predictable, the new prescription was derived in hindsight. All the output has physical causes, and much more of it is understandable than is predictable.
For statistical purposes the noise in a system , hopefully a component with seemingly well defined statistical properties, is normally thought of as being inexplicable in the sense that it contains information other than that contained in or can be derived from the initial state and the on going inputs, i.e. information additional to the prescription.
It is not clear to me that such noise exists in this case, but if weaken the definition to include information of which we just happen to be ignorant then it is plentiful.
As for the underlying trend, I cannot give this meaning beyond identifying it with the part that we can currently, understand, explain, and maybe even predict, the part of which we are less ignorant.
The history of our planet is what it is, a history, it is not signal and noise separable on any objective basis , it is what happened. It is not a repeatable experiment, over which we can average and sift the signal from the total. All we can do is separate that which we can explain and perhaps could have predicted from that which we cannot.
If the inexplicable seems to have useful statistical properties then we can apply statistical methods but I do not think we should regard this as anything other than an arbitrary and subjective method, rooted in ignorance.
I think the problem here is somewhat different. What we have is a set of models that purport to reflect the behaviour of a complex system to the extent that they can usefully project future states. Those projections are differing from what is being observed.
The question isn’t about what’s noise or signal, we know the models have real limitations in this regard, it is about whether those models are useful, and more particularity whether there recent performance out of sample reduces our confidence in them.
I fear the answer to that question has to be “inevitably”.
I think the problem with much of the above discussion is that it proceeds from the assumption that the models are a reflection of the real world. They aren’t, we know that from the limitations of the information used to create them and their structure.
The appropriate question is how useful are they for the various uses we might want to put them? If it is to understand in-sample relationships between bits of the system that they model well the answer no doubt is “yes”. If it is to reduce risks in possible 50-100 year future climate states one needs to be more circumspect and their short-term performance out of sample becomes particularly relevant.
We are keen to understand future uncertainties (that is at the heart of risk). The model ensembles are often offered as reflecting the future uncertainty in the real system. The question is whether our confidence in the models’ ability to reproduce the uncertainty has increased or decreased over the last 15 years?
Notwithstanding the recalculations based on actual inputs over the out of sample period reducing the divergence actual and models, the differences remain. This along with the recent work on climate sensitivity and feedbacks for example suggests the models are underestimating the uncertainty, at least on the downside. That is (or should be) the concern for both the model and policy makers.
In the spirit of George Box’s “All models are wrong, some are useful”, maybe the discrepancy between the IPCC’s model predictions and observed slowdown hints at that the models are maybe a bit less useful than previously accepted?
That there was something from which to temporarily slow down only to speed up yet again suggests otherwise.
Ed, you briefly refer to Fife et al. article as a response to the nonsense from Karl et al. and Lewandowski et al. and I would agree that this does need correction. But when Fyfe et al. state that they used “… annual average anomalies of global mean surface temperature (GMST) …. averaged over 124 simulations from 41 climate models” I have to draw the line somewhere. 124 simulations from 41 climate models is simply not science. After 26 years of failed climate predictions it is time to close that pseudo-scientific operation. You are right that very clearly there has been a change in the rate of global surface warming but you do not understand what is going on. I also don’t particularly like the small scale you chose for figure 1 because the compression needed for it destroys data and you can’t read the scale. And your figure 2 unfortunately is a joke. I also suggest that you should forget about CMIP5, it is ridden with these same defective models. Here I will chiefly concentrate on data from 1979 on (the beginning of the satellite era) and our century. We start out with a hiatus in the eighties and nineties that you probably know nothing about because thanks to criminal machinations it is now covered up by a non-existent “late twentieth century warming.” If you want to see what it really looks like, see figure 15 in my book “What Warming?”. The hiatus is followed by the super El Nino of 1998 which is not part of the ENSO oscillation that precedes it. The super El Nino comes and goes faster than the other five El Ninos preceding it and its peak is also twice as high. It is followed by a short step warming that raised global temperature by one third of a degree Celsius in only three years and then stopped. Its origin is oceanic – warm water carried across the ocean by the super El Nino – but Hansen decided it must be anthropogenic. Proof of this to him was the fact that out of ten warmest years, nine were part of the first decade of the twenty-first century. That is not how it works. It is impossible to stop greenhouse warming because you would have to pluck every absorbing carbon dioxide molecule out of the air. And the step warming that caused it all did end in 2002. Hansen also got the identity of the ENSO peaks in the eighties and nineties screwed up. Speaking to the Senate in 1988 he thought there was just one warm peak there when in fact there are five peaks of equal height. Just poor resolution of the graph he showed them. Nevertheless, he claimed to the Senate that there had been 100 years of warming and stated that “Global warming has reached a level such that we can ascribe with a high degree of confidence a cause and effect relationship between the greenhouse effect and and observed warming.” To paraphrase: “If it gets warm it must be the greenhouse effect.” This is not science but was used to justify starting up the IPCC in 1988. The step warming I referred to is responsible for the fact that the 21st century hiatus is at a higher level than the one in the eighties and nineties was. This fact has been used to define numerous “warmest” years in the twenty-first century. It is not permissible to compare the temperatures of the twentieth and twenty-first centuries directly because of the intervening step warming. If you want to compare them, you must first subtract that third of a degree Celsius from the twenty-first century datum used. That is because the extra height of the twenty-first is not anthropogenic but oceanic as I pointed out. If you do apply this correction you will find that the twentieth and twenty-first century real temperatures were pretty much the same. Since the extra warmth should really be regarded as a one-time addition we should look for a gradual reduction of the hiatus level with time. This was not obvious in 2008 when I first observed it. The temperature region is somewhat irregular but now it is possible to observe that the hiatus level from 2002 to 2012 really does show some lowering with time. (After that the warming by 2015/2016 El Nino takes over.) There is more but this pretty much should straighten out your thinking about the early 2000 warming slowdown as you like to call it.
Isaac Held: 58. Addicted to global mean temperature
““Everything should be made as simple as possible, but not simpler.” There is evidently no record of Einstein having actually used these words , and a quote of his that may be the source of this aphorism has a somewhat different resonance to my ear. In any case, I want to argue here that thinking about the global mean temperature in isolation or working with simple globally averaged box models that ignore the spatial structure of the response is very often “too simple”.
One of my major problems with discussion of the ‘Pause,’ ‘Hiatus,’ or ‘Slowdown’ (PHoS) is that it’s simply not true when speaking of AGW. To many of the public, and especially pseudoskeptics, the PHoS meant AGW – not observed GMST. And as Held points out, it wasn’t really even a PHoS of GMST, but northern hemisphere winter temperature.
AGW is about how increasing GHGs will warm the earth. That includes more than just the atmosphere – much less the surface. Every discussion by scientists of the PHoS should have been explicit — at the outset — that OHC indicated little or no PHoS, but that their investigation was really an investigation into the distribution of energy and how it manifests itself at the surface as reflected in GMST. I.e., there was no PHoS in AGW, but there was an unexpected distribution within the total earth system (land, sea, atmosphere, and cryosphere).
Of course if half of the voting population of the USA wasn’t borderline insane this tempest in a teapot would have been of little note.
Please end the italics at the end of the Held quote: …..the response is very often “too simple”
Thx
Dear Dr. Fyfe: It looks like you presided over an assembly of global warming big guns and yet came out with a relatively moderate view of the hiatus situation. Are you in this group too? I did not say your science is correct because it isn’t. You claim that “ …the so-called .. hiatus was due to the combined effects of internal decadal variability and natural forcing (volcanic and solar) superimposed on human-caused warming.” Nonsense. First, there is no human-caused warming. Second, volcanic and solar have nothing to do with it. And third, there is no sign of any decadal variability. To this should be added use of falsified global temperatures by NOAA, GISTEMP, and HadCRUT 4.4. The last three refer to covering up the hiatus of the eighties and nineties with a phony “late twentieth temperature warming.” Let me tell you what global temperature really did since the start of the satellite era. First, there was a hiatus lasting from 1979 to 1997 that has been wiped off the face of the earth by your temperature specialists. To me that is a scientific crime. You will find that hiatus as figure 15 in my book “What Warming?” They removed it from all ground-based temperature records but it is still there in satellite records. The hiatus was followed by the super El Nino of 1998. And as soon as that one left a short step warming appeared and raised global temperature by a third of a degree Celsius in only three years. This increased all twenty-first century temperatures that followed above the preceding twentieth century level. As a result, numerous people have been claiming “warmest ever” temperatures in the twenty-first century. It is not permissible to compare the twentieth and twenty-first century values directly because of the intervening step warming. If you do want to compare them, you must first subtract a third of degree Celsius from the twenty-first century data. If you do that you will find that the corrected temperatures of the two centuries line up and are more or less even. Since the warming that raised the twenty-first century temperature was a one-time event we should look also for a long-term cooling effect in the twenty-first century. This was not obvious in 2008 but looking at it today you can see a slight cooling between 2002 (hen the step warming stopped) and 2012 (when El Nino of 2015/2016 began to grow). This also shows up in Rahmsdorf’s work cited. There is more but I will stop here.
This summary should be helpful if you need to do more work in this area. If you disagree with me simply let me know and I will explain.
Sincerely, Arno Arrak
I’ve just posted my most recent thoughts and analysis above this.
Note that link jumps you right down to where my analysis and results are reported. The material above it was a rebuttal of Professor Jamal Munshi’s various comments and publications on his perception that correlations between CO2 concentration series and temperature were fallacious, as was brought to my attention at Tamino’s blog in a post about Data Science.
It would be nice to see some further reflections from the scientists involved on the alleged “slowdown” given the latest data on global mean surface temperatures.