We are all familiar with the usual metrics used to highlight that the climate is changing: surface air temperatures, sea level, sea surface temperatures and ocean heat content all rising, glaciers retreating, Arctic sea ice declining etc. But, there are also many other less well known sources of information about how our climate is changing, and many involve ‘citizen scientists’, who often didn’t realise the potential long-term benefits of the data they were collecting.
Without reliable meteorological observations over the past few centuries (or access to a time machine), climate scientists have to rely on piecing together evidence of historical changes in climate from a wide range of sources. Interpreting this data is often not straightforward, but a consistent picture does emerge.
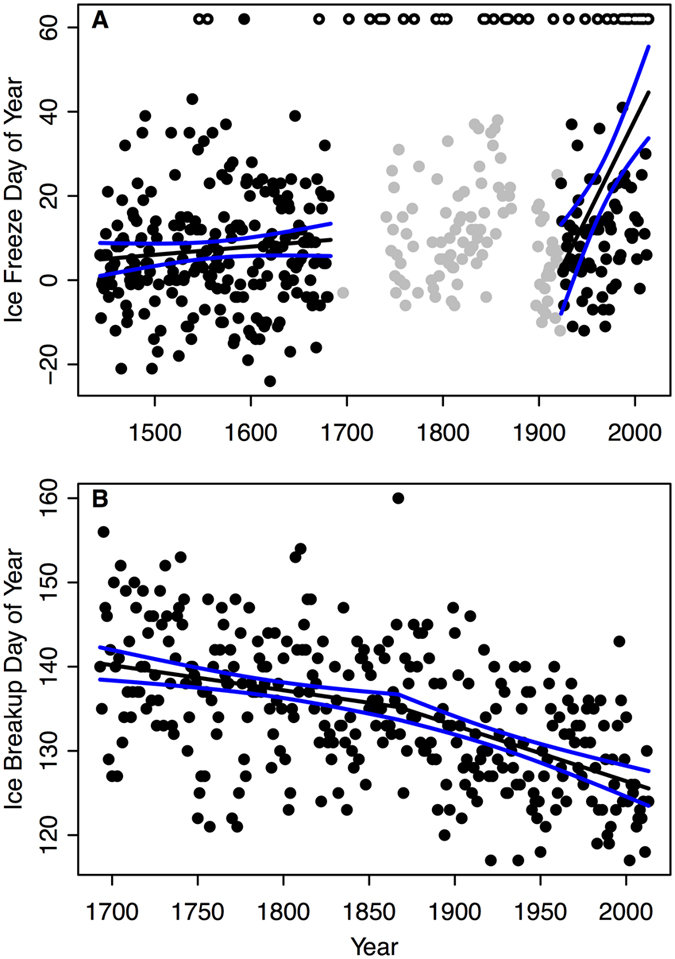
For example, there has been a recent study examining ice freeze dates in a lake in Japan back to 1443, and ice break-up dates in a river in Finland back to 1693 (also summarised by National Geographic). The Japanese measurements were taken by monks as part of a religious ceremony, and the Finnish measurements were started by a merchant involved in river trade. Both show changes over time, consistent with warming temperatures, although local non-climate factors will also clearly be important (Figure 1).
Similarly, in North America, the annual dates in the spring when winter ice cover leaves a lake has come to be known as ‘ice out’, and these dates have been measured by those who live on the lakes since 1836. A recent study analysed records from 12 lakes (Figure 2) and all show consistent trends towards earlier ‘ice-out’ dates. There is also considerable variability, likely due to contributions from variations in the atmospheric circulation, such as the North Atlantic Oscillation.
The Nenana Ice Classic is a similar record, measuring the break-up of ice in Alaska since 1917. 2016 was one of the earliest break-ups in the long record.
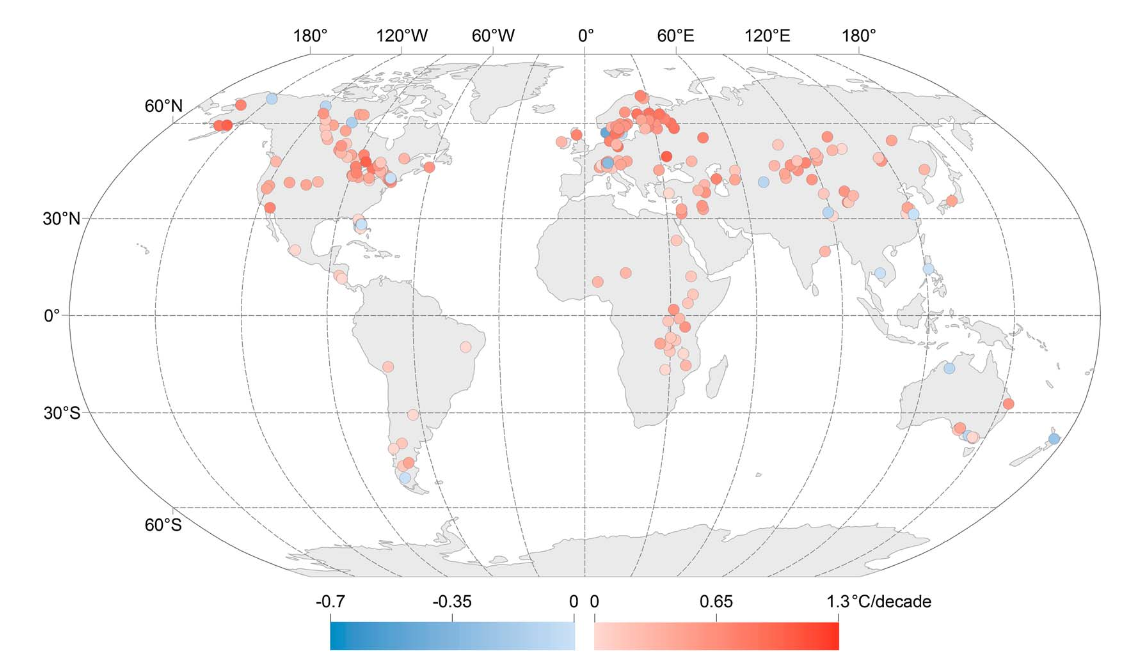
Another source of not-often-discussed climate data is lake temperatures. Summer lake temperatures, using in-situ measurements and satellite data, have increased in the vast majority of lakes across the world (Figure 3). These changes are important as warming surface waters means less mixing with deeper waters, depriving the lower layers of oxygen, with harmful consequences for lake marine life. Longer records based on only in-situ data back to 1910 are also under construction.
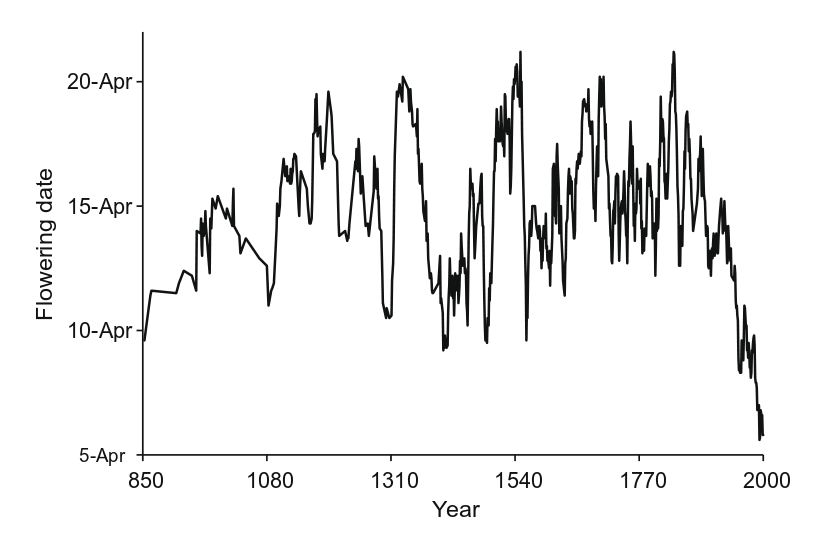
Moving to the natural world, one of the longest records is from Japan, where the flowering of Cherry trees has been recorded for centuries. A study in 2009 highlighted considerable variability in the flowering day in Kyoto, with a recent trend toward earlier dates (Figure 4). A temperature increase of 1°C moves the flowering dates around 3-5 days earlier. Urbanisation effects are important in this example, but trees from a range of local environments allows the climate related signal to emerge.
A final recent example is grape harvest dates in the Czech Republic (available since 1499), which have become much earlier in recent decades due to rising temperatures (Figure 5). There are obvious non-climatic factors which influence the date of grape harvest (e.g. wars, taste etc), but the grape type has apparently been rather constant.

Other records of this type have been discussed elsewhere, such as the London Thames Barrier closings, the Elfstedentocht, location of English vineyards, and I am sure there are many, many more.
Overall, these non-traditional measurements of climate tell a consistent picture of a warming world, with considerable interannual and decadal variability, and local non-climatic factors affecting many aspects of traditional events and measurements.
More needs to be done to rescue the billions of instrumental weather observations taken since ~1800, which are currently languishing in various archives around the world (e.g. OldWeather.org), but I would be interested to hear of any ‘data rescue’ activities needed for these non-standard types of observation too.
The ice-on/ice-off dates and other phenological records are one of the main reasons I always tell pseudoskeptics we would know the world is warming even if we never looked at a single thermometer or GCM output.
Growing up in Wisconsin next to Lake Superior and with numerous inland lakes nearby the changes over the course of 50 years have been noticeable. I actually half-believed perhaps I was just growing old and it *seemed* that in my youth summers were colder, shorter, etc., etc. Fortunately the internet came around and I was easily able to search and find out I wasn’t going prematurely senile – well, at least not based on that recollection 🙂
My favorite story is of Bayfield, Wisconsin H.S. student Forest Howks who used old newspapers and ferry records to research changes in winter ice between Bayfield and Madeleine Island.
A presentation on his science project can be found here: Forest Howks Bayfield Harbor Ice Presentation-2012
HI Kevin,
Many thanks – that is a great story! Do you know if the data ever got published in a scientific journal?
The 1877(?) data point is particularly intriguing, as there was a very large El Nino event then, and I see that 1997 was also very low, coincident with another large El Nino.
cheers,
Ed.
Kevin, I can see the same, not so much in my own lifetime, but in hearing the stories from my parents and, before they were gone, grandparents about the differences in the regional climate.
I blame scientists themselves for us “pseudoskeptics”–I’m going to put myself into the category you’ve created because I am still trying to parse my way through all of the insanity that is climate science. I in no way deny climate change, or even global warming, but I have to say from the outside looking in that scientists have done a poor job of communicating what is actually going on. In fact, I’m not sure climate scientists as a group even KNOW “what is actually going on”–between uncertainty and complexity, my position is that it’s OK to not be so damned certain.
As this sensible blog points out time and again, there are a whole lot of worst case scenarios that the rabid, zealous believers want to happen, which are simply not showing up in the observable data. Being zealots, they immediately jump to attack anyone who takes a step back and *GOD FORBID* questions the models (you know I am not talking about you! <snip>). I thought that was what science was for–questioning everything. It seems to me that the pseudoskeptical position might be the best from which to approach the science. Perhaps we are not defining it the same way?
Hi Sarah,
Thanks for your comment.
As scientists we are trained to be skeptical and we always should remain so. However, there are those who pretend to be skeptical, but ignore the overwhelming weight of evidence about the issue, or assume we are all fiddling the data somehow. Perhaps it is this group which Kevin refers too? It does not sound like you are in that group. I also agree that there are examples of ‘rapid believers’ who over-hype the effects of climate change, but these are not usually academic climate scientists. And, I agree that we have not always communicated brilliantly – but please ask specific questions that you are confused about, and we can try and answer them!
cheers,
Ed.
I’m going to push back at this a bit
I think this is a cop out. People are responsible for the views they hold and are also responsible for working out which sources are typically reliable and which are not. There are plenty of reliable resources out there for those who are willing to put some effort into finding them.
Scientists are also primarily researchers, and although they do have some obligation to communicate with the public with policy makers, they are not responsible for the views that these people may choose to hold, or the decisions that might be made, given this information. If we look back and decide that we didn’t do enough, or didn’t act soon enough, it is not going to be the fault of scientists.
Also, many examples of scientists supposedly exaggerating are often second-hand and typically ignore all the caveats and uncertainties that were presented. As Ed says, there are probably few examples of active climate scientists who over-hype the evidence. It does sometimes happen, but maybe consider the significance of people who – by training – tend to be cautious in what they say, saying things that might sound rather extreme. Maybe they’re trying to tell us something?
Specialization is an issue in getting a clear picture ; there’s this CO2 specialist, than that methane specialist, than that oceanographer, the glaciologist, the atmospheric guy, the economist, the geo-engineering bunch with a few specialties there alone… CCS, SRM which have their own sub-specialties.
I guess that one reason why the big picture seems so fragmented to many like you.
Good luck with putting that puzzle together; there’s not even an image on the box.
Good luck and take care Sarah.
I’m on G+ btw and I write a French climate change blog there.
But I’m not a specialist…
Jack
Sara – I sincerely hope you are actually skeptical, not ‘pseudoskeptical.’ As Ed rightly guesses ‘pseudoskeptic’ is a phrase used to define those that pretend (or self-proclaim) skepticism, but believe any old cockamamie theory that ‘disproves’ AGW. John Mashey coined it (IIRC) and it seems appropriate for the may of those that reflexively believe it’s anything but CO2.
Ed, yes it was published. Journal of Great Lakes Research 35(1):159-162. 2009,
doi: http://dx.doi.org/10.1016/j.jglr.2008.11.002
Changes in Lake Superior Ice Cover at Bayfield, Wisconsin, Forrest Howk
At first I thought that he lake ice stats have much more variability than the grape harvest dates. And I wondered if that is the nature of the respective climates (less variability in wine regions) and/or if ice dates are more sensitive to short term recent weather (prior week-scale) while the ripening of a grape integrates weather over the entire summer? (I like the latter guess.) But then I noticed that perception was maybe due to the graph scales, and the grape variability wasn’t all that much smaller. Still, the trend at the end for the grape harvest dates seems much more distinct compared to the past record than the lake ice trend. (I don’t have a question here. I just find these types of data sets interesting.)
I should say I don’t have a clear or specific question. But a discussion of differences between the data sets would be of interest, both in the raw stats of each and in trying to decipher underlying “physical” causes.
Here is a paper on grape harvest dates in France.
http://www.clim-past.net/8/1403/2012/cp-8-1403-2012.pdf