Many of those skeptical about the causes of climate change suggest that the complex global climate models (GCMs) often used to make attribution statements are not trustworthy. Here I highlight that GCMs are not needed to roughly attribute nearly all of the observed warming (at least) to changes in greenhouse gases.
This simple attribution consists of a number of steps:
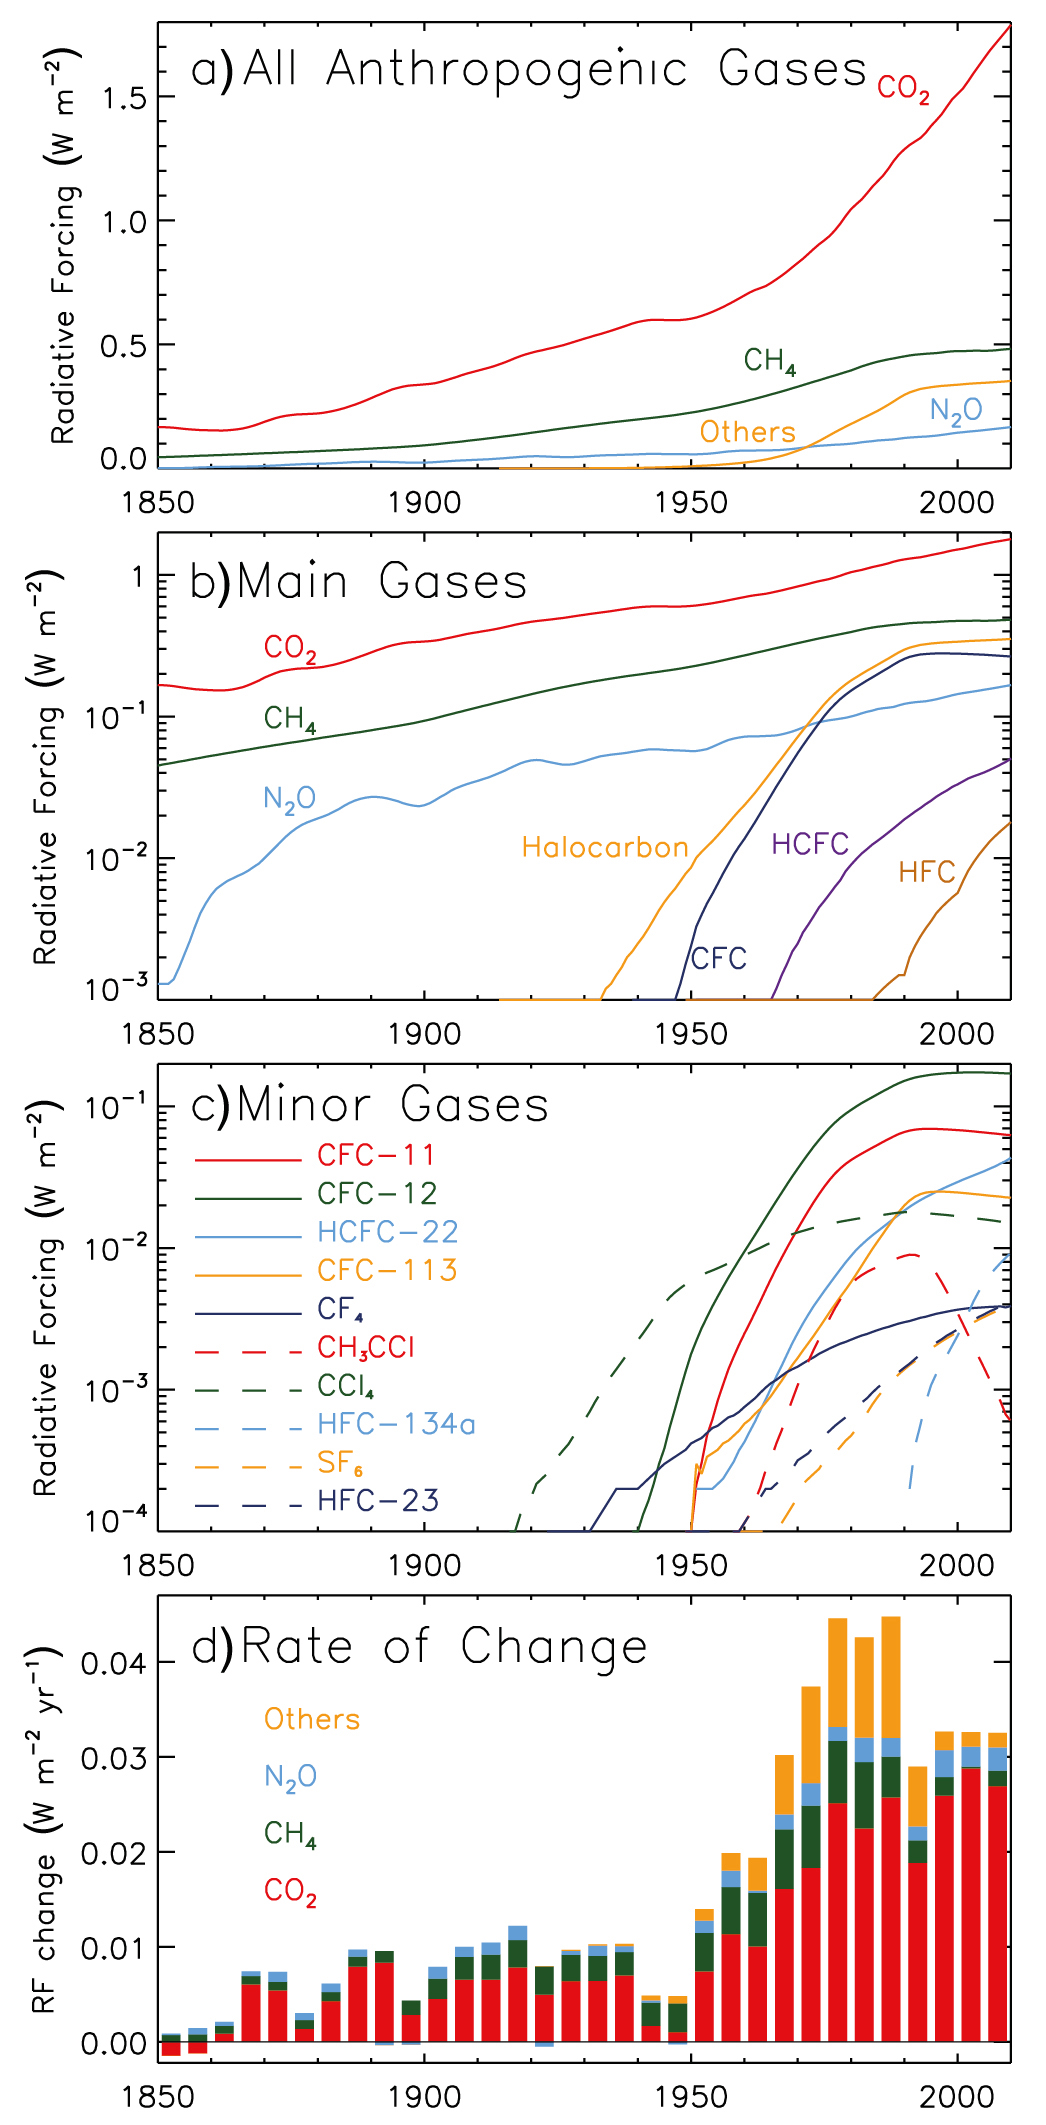
1) Well-mixed greenhouse gas (GHG) concentrations have increased since 1750 due to human activity. These GHG changes include CO2 (278 to 400ppm), CH4 (0.72 to 1.8ppm), NO2 (270 to 325ppb), as well as other gases such as CFCs. The uncertainties on these observations are very small compared to the changes.
2) The radiative forcings of these changes in GHG concentrations are calculated using ‘line-by-line’ radiation codes which examine the absorption of radiation by atmospheric constituents. These produce an overall change in radiative forcing of around 2.8 Wm-2 since 1750, or around 2.6 Wm-2 since 1850 [see Figure 8.6 and Table 8.6 of IPCC AR5]. The same radiation codes produce a value of around 3.7 Wm-2 for a doubling of CO2. The uncertainty on these values is around 10%.
3) The warming at the time of a doubling of CO2 is denoted by the transient climate response (TCR). Here we assume that all GHGs have the same climate sensitivity.
4) A simple model for the expected warming due to a change in greenhouse gas radiative forcing is:
ΔT = TCR × [ΔF(observed) / ΔF(2xCO2)]
5) Even assuming a low value of TCR (=1.0K), then a change in forcing of ΔF(observed)=2.6 Wm-2, when compared to a ΔF(2xCO2)=3.7 Wm-2, produces an expected warming of 0.7K since 1850. If TCR is relatively high (=2.0K), then the expected warming from GHGs alone is 1.4K.
6) The observed change in global temperatures is around 0.8K since 1850. So, even if TCR is at the very low end of the IPCC expectations, the changes in well-mixed greenhouse gases have produced a warming of comparable magnitude to that observed. If TCR is larger, then the fraction increases to be larger than the observed warming. And, this is all without using any GCMs.
7) Of course, other factors are important for how global temperature changes, but this calculation is independent of assumptions about those other factors. Changes in aerosols, volcanoes and land use act to cool the planet and offset the GHG induced warming & internal climate variability, ozone and solar changes are also important. These other forcings may even have a different ‘efficacy’, but this doesn’t affect the simple calculation above. These calculations also allow a direct comparison of the strength of the forcings. For example, net changes in solar forcing are around 0.05Wm-2 – much lower than that for GHGs.
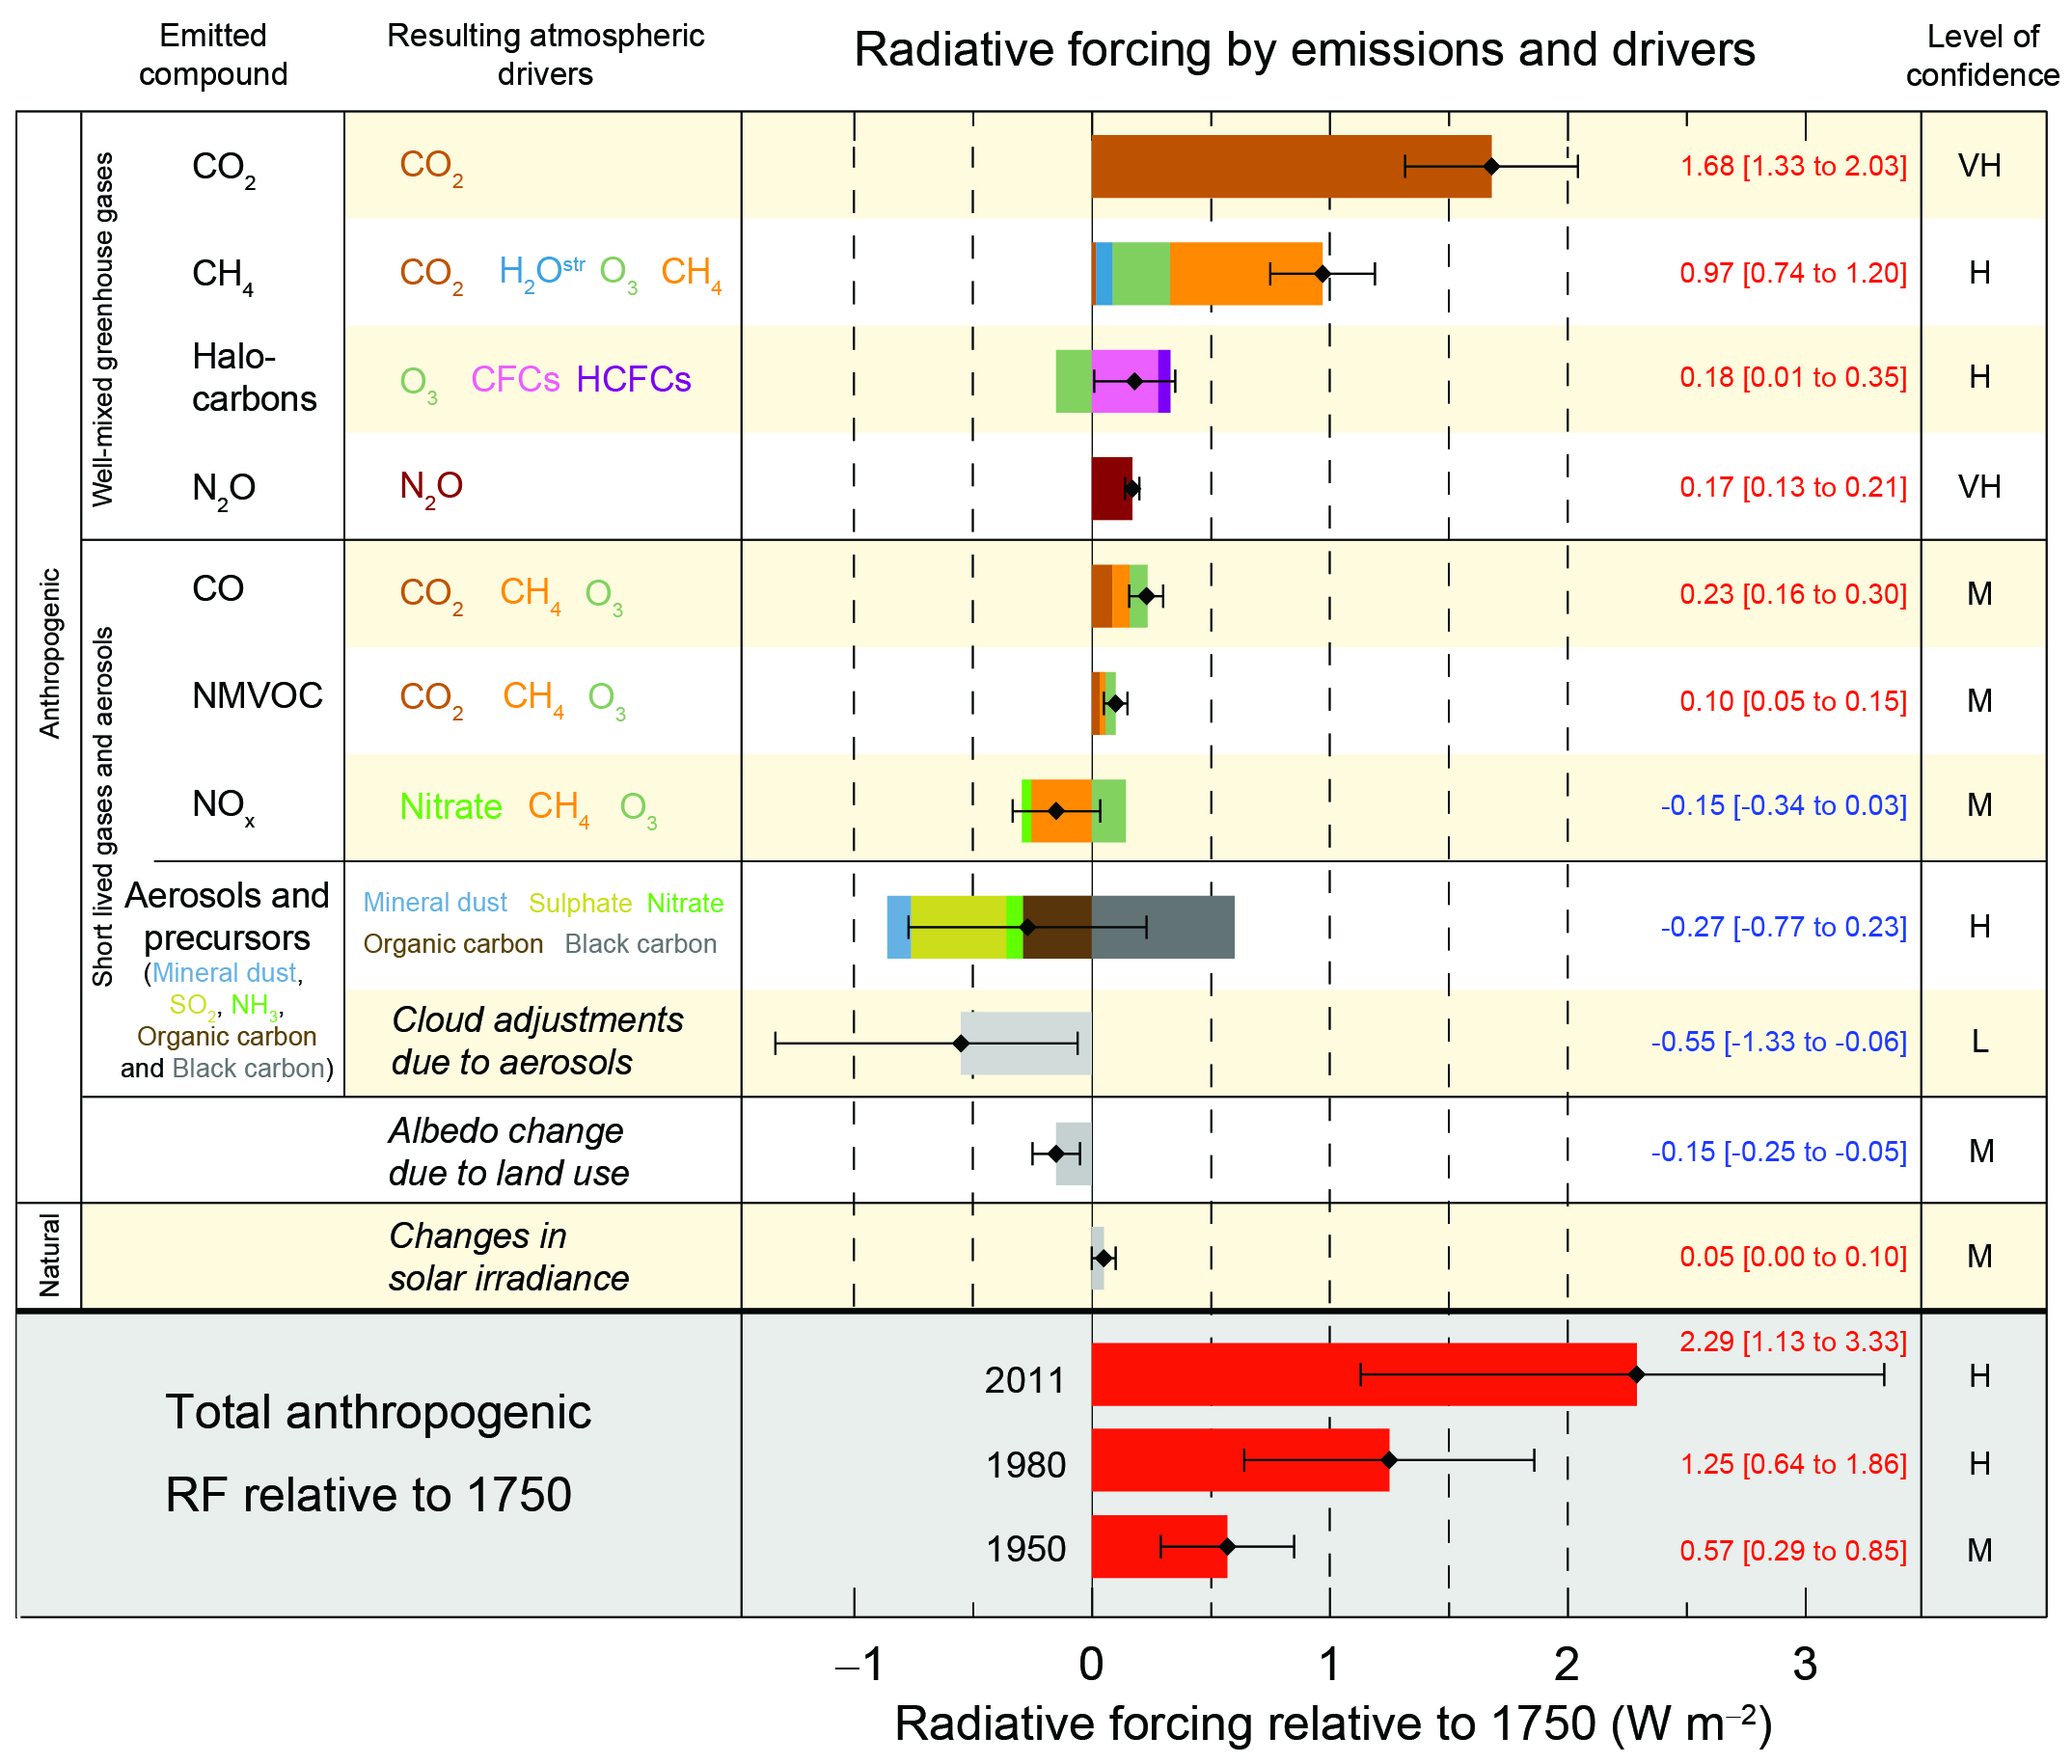
In summary, changes in atmospheric greenhouse gases due to human activity have caused a large fraction of the observed warming. It is even likely that GHGs actually produced more warming than that observed (also see Figure below which is TS-10 from IPCC AR5 WG1), but this has been partially offset by other causes, such as changes in aerosols.

I wonder if this will affect the opinions of those who refuse to accept that GCMs are useful because you’ve just admitted that this approach relies on models too.
Luckily it’s easier to test radiative transfer models. Tjemkes et al. (doi: 10.1016/S0022-4073(02)00174-7) and Feldman et al. (doi: 10.1038/nature14240) fit very nicely with your step 2), and if someone still argues over that point after being shown those then I think you’ve just diagnosed them with evidence immunity.
Thanks Mark – two good links demonstrating the observations of the forcing directly.
Ed.
2.6 W/m2 of GHG forcing produces 0.8C of TCR warming.
3.7 W/m2 of CO2 forcing produces 3.0C of ECS warming then.
Square the circle please.
Hi Paul,
Your 0.8C is from the observations which confuses many other factors and not the right number to use.
Maybe you meant 0.7C which is the GHG contribution using 2.6W/m2 for a TCR of 1.0K? But, note that we wouldn’t expect a TCR of 1.0K to produce an ECS of 3.0K.
The assessed IPCC ranges for TCR (1.0-2.5K) and ECS (1.5-4.5K) are not independent. In the GCMs, there is a relationship between their TCR and ECS (see IPCC AR5 Fig. 9.42).
cheers,
Ed.
I agree with everything you write above. The only quibble would be the implicit assumption that natural variation averages to zero since 1951. Natural climate variability AMO/PDO seems to have a cycle of ~60y which turned neagtive after 2000 – hence the pause. If this is the case then net contribution from 1951-2010 would then be positive reducing ANT by ~0.2C.
Thanks Clive – I agree that if there is a net positive variability contribution since 1951 then this would reduce the amount of warming due to anthropogenic influences as denoted in the IPCC AR5 figure. Also – would you say that variability has a net zero (or small) contribution since 1850?
But, all of that doesn’t affect the back-of-the-envelope calculation about the amount due to GHGs.
cheers,
Ed.
Clive the AMO/PDO whilst exhibiting periodicity are not in phase. Its arguable that the PDO turned negative in 2000;
http://research.jisao.washington.edu/pdo/
Whilst the AMO was certainly in its warm phase in 2000;
https://en.wikipedia.org/wiki/Atlantic_multidecadal_oscillation#/media/File:Amo_timeseries_1856-present.svg
All I’m suggesting is that all the possible states; -PDO/-AMO, +PDO/-AMO, -PDO/+AMO, +PDO/+AMO are likely to have a profound effect on global temperatures and macro weather patterns and extreme events. It gets more complicated as ENSO events still occur within the context of the PDO phase. La Ninas predominate in a cool PDO and El Ninos more so in a warm PDO.
Currently the June PDO is 1.54 the highest since “97” H/T Phil Klotzbach’s Twitter thread
https://twitter.com/philklotzbach?lang=en
Apologies to Ed for going slightly away from his “very useful back of the envelope” post
I agree AMO/PDO should average out to zero since 1750. Your back of envelope calculation is fine, but it could affect Fig 10.5 shown above.
cheers
The terminology – the PDO turned negative in 2000 – is unhelpful. In terms of how the PDO effects the global mean temperature, the PDO turned negative around 1983. I believe this is the only time the PDO has ever broken with the trend direction of the surface air temperature in any major way: PDO headed south and the GMST headed north. Everybody seems determined to ignore this, and just slide over to the AMO. Why? Around 2006 the PDO index entered persistently negative numbers, but that was just a continuation of the negative effect it has had to the GMST since 1983. This likely caused “the pause”.
negative trend since ~1983
Imo, the AMO is a complete tease.
Hi JCH the PDO in 1983 was positive, it’s noisy and there are still dips into La Nina conditions, but the positive phase continued into the early 2000’s. Using the The NCEP CFSR/CFSv2 global 2 meter temp anomalies GMST gives a rising trend from 1983 to 2007 and then a slight fall to the present 2015 with a new record high looking likely as the very strong El Nino matures in time for Paris! Hiatus definitely over?
Alas I can’t link to Dr Ryan Maue’s excellent rendition of the CFSv2 data set without permission.
Hi Ed,
As a back of the envelope theoretical calculation of how well mixed GHG emissions might theoretically be expected to influence global temperatures since the beginning of the industrial age, this is fine, but it can hardly be looked upon as a reliable statement of attribution.
Just looking at the error bars on your IPCC graph of observed and attributed temp changes above, it seems fairly clear that there is large uncertainty inherent in these calculations of net radiative forcings.
If you look at p.25 fig. TS.6 of:
http://www.ipcc.ch/pdf/presentations/ar5/wg1/WGIAR5_IPCC_Jakarta2.pdf
Total anthropogenic forcings since 1750 are calculated to be anywhere between just over 1 W/m2 and 3.3W/m2., the main reason appearing to be that there is low confidence in anthropogenic aerosol/cloud interactions.
IPCC also attribute virtually none of the observed radiative forcing to solar activity, which given the wealth of research on solar UV variability and amplification mechanisms, is suspect to say the least. If we assume that solar is in fact greater than supposed by the IPCC, you then also have the task of disentangling natural oceanic variability from solar influences. All in all, the situation regards attribution of post industrial climate change is far more complex than merely summing line by line spectral radiative contributions from atmospheric constituents – in my opinion.
Hi Jaime,
The key point of this post is that the forcing from GHGs is very well known and understood. Even if TCR is low, the GHGs have produced a warming of roughly the same size as the observed warming – this is robust. Note also the links in the first comment – the line-by-line radiation codes can be tested easily and the forcing has been directly observed.
Obviously the main uncertainty in whether the GHG warming is much larger than the observed warming is due to the aerosol effects & interaction with clouds. With regard to solar – it is obviously considered, but it cannot be a large effect or we would see a clear 11-year solar cycle in the observations, which we don’t.
So, the precise attribution has some uncertainties, but it is very robust that GHGs have caused at least 0.7K of the warming seen (& probably more). Do you dispute this point?
cheers,
Ed.
“you then also have the task of disentangling natural oceanic variability from solar influences. ”
Well said Jaime, “apparently” there is a correlation between sunspot activity and ENSO; El Ninos tend to come off from a peak in solar(sun spot) activity and also going out of the dip of a minimum. Yet to see the the physics on this so I’m yet to be convinced. H/T Joe D’Aleo.
At the end of the day there is a high degree of interdependence between all the variable which makes imputing causality rather hard, to say the least.
That said I like Ed’s calculation notwithstanding that TCR, itself may have “epistemic ” problems in an Earth system that is non-linear and chaotic, at least very noisy. My hunch is it cannot be taken as a “constant”.
When doing an experiment, such as in chemistry, one generally does not first set out to repeat all the experiments that were done to establish the scientific knowledge upon which the experiment is based.
Hi Ed,
The observed warming is 0.8C. The warming which can be attributed to well mixed GHG contributing a forcing of 2.6W/m2 is 0.7C. However, the uncertainty in total anthropogenic forcings means that the net anthro radiative forcing may in fact be as low as 1.1C, or as high as 3.3C. The former would require that natural forcings contributed very significantly to the observed warming, the latter would require that natural forcings offset the observed warming fairly significantly (which seems unlikely given what we know about natural variability since 1750)
So basically, even though well mixed greenhouse gas forcing is robustly defined and experimentally ‘confirmed’ by the Feldman et al Nature paper, uncertainty in anthro aerosol forcings still leaves the possibility that not even half of the actual observed post industrial warming can be attributed to anthropogenic factors, in which case natural variability has been seriously underestimated by the IPCC.
Oops, sorry, 1.1W/m2 to 3.3 W/m2, not C!
Hi Jaime,
I think Ed’s being quite insightful here. The contribution of the well-mixed greenhouse gases really can be constrained from quite simple principles and even if you think that TCR is on the low end and around ~1 C you’d still attribute most of the recent warming to GHGs.
But you’re right to point out that you might accept this but still not accept majority anthropogenic attribution because of the uncertainties in other issues. But that’s not relevant to the greenhouse gas contribution, we just know that if you think TCR is low, you’d attribute about 0.1 C of warming to everything else added together. Sure, you might think that aerosol cooling is strong, say -0.6 C, which would mean anthropogenic warming isn’t dominant.
That’s really interesting and needs different evidence (which the IPCC calls upon), but this post just points out the greenhouse contribution alone and I think it makes the point pretty clearly: simple energy balance with well-tested models supports a dominant greenhouse gas contribution to recent warming. More than 100% is also perfectly realistic.
Another point here is that if TCR is low then the aerosol cooling will probably be at the low end of expectations also. And, of course, aerosols are projected to disappear from the atmosphere fairly quickly over the next ~20 years so we will be left with only a GHG (& natural forcings and variability) response.
Ed.
Ed your post has really got me thinking. Is TCR invariant in a multivariate Earth system ie is it “assumed” to have a calculable value irrespective of any initial conditions of the “whole” over the doubling period of CO2?
Hi Steve,
Interesting question. We do ‘assume’ that TCR represents the climate sensitivity to a doubling period of CO2 in current climate, but recognise that there might be some limitations.
1) we know that ECS (and presumably TCR) is state dependent in models – i.e. if you do a doubling of CO2 from very cold conditions, e.g. the last glacial maximum then ECS is different to when using the same model in current climate. These experiments suggest that sensitivity is slightly larger in warmer climates I think.
2) we have done experiments with 1%/yr CO2 rates with the same model multiple times from different initial (ocean) conditions in the same control climate and get slightly different answers due to natural variability (but the range is much smaller than the inter-model spread).
3) we also suspect that climate sensitivity is different for different forcings – the ‘efficacy’ issue.
4) the rate of increase of forcing may also matter, i.e. CO2 increasing at 1%/yr may produce a different TCR than 2%/yr etc, but I think this is relatively small effect.
cheers,
Ed.
Thanks Ed.
Is that not simply because for the same forcing DS (eg. doubling of CO2) the response (TCR) for two different initial temperatures T1 and T2 would be
DT2/DT1 = T2^3/T1^3
TCR(T2) = TCR(T1) * (T2^3/T1^3)
for T2 = 288K and T1 = 283K
TCR(now) = 1.05*TCR(LGM)
Hi Clive,
That is one of the first order effects. But, the albedo and emissivity of the atmosphere would also be different at the LGM which would likely change the feedbacks too.
[Just finalising a paper which touches on similar issues of mean state dependence of climate sensitivity actually.]
cheers,
Ed.
And if TCR isn’t low and a compensation from aerosols disappears over the next ~20 years, what then?
Is there any direct independent observational evidence of a TOA energy imbalance of 0.6 w/m2 ? CERES data was simply adjusted AFAIK so as to agree with models since it was not accurate enough to measure the difference of two large numbers (ISR – OLR).
Yes ocean heat content has risen but just how accurate are ocean temperature profiles – Argo buoys etc. ?
Clive Best,
If you lift the 0.6 W m-2 from Smith et al. 2015 (doi: 10.1002/2014GL062669 ), they describe their method for working out the CERES imbalance: it comes mostly from Argo with minor contributions from the deep oceans, ice melt etc. A model (well, reanalysis) is used to fill in gaps in the CERES record but as I understand it, only for the variability – the long term net is from obs rather than models.
Levitus et al. 2012 (doi: 10.1029/2012GL051106 ) report error bars and say how they got them in the supplementary material although Smith et al. do theirs differently iirc, since they were looking at trends rather than OHC anomalies and wanted to include some other systematic uncertainty.
Now running from memory of talks I’ve attended: I believe there’s more uncertainty from regions that are difficult to sample with Argo – under sea ice and around the Maritime continent for example. I saw talks that I think suggested there‘s been extra heat buildup there that was being missed by the main records. The Meehl “hiatus periods” (urgh, I don’t think hiatus is an appropriate word at all for the recent period, but it’s in the title) paper shows modelled patterns of extra surface warming there, while AVISO sea level rise shows a spike that’s consistent with the other expectations of “hiatus periods”. Anyone have any references to clarify this?
I don’t have the primary sources in hand … How big are those error bars? Meaning, what are their quantiles?
Hello MarkR,
My main objection to Ed’s post is the attribution of most or all of the warming from 1750 to present to anthropogenic GHGs. This conclusion is not well supported, even by the IPCC. I quote:
“It is unequivocal that anthropogenic increases in the well-mixed greenhouse gases (WMGHGs) have substantially enhanced the greenhouse effect, and the resulting forcing continues to increase. Aerosols partially offset the forcing of the WMGHGs and
dominate the uncertainty associated with the total anthropogenic driving of climate change.”
If, because of the concomitant rise in anthropogenic aerosols, warming due to fossil fuel emissions has been limited to say, less than half of the observed rise (possible within the IPCC’s stated bounds of uncertainty), then this begs the question: what natural forcing contributed at least 50% to the observed temperature rise? Periodic internal variability appears to cancel out over this period of 250 years plus, which leaves only solar really to explain a significant part of the observed warming; ergo, the IPCC’s assessment that solar contribution is minimal is disproved.
Hi Ed,
“Another point here is that if TCR is low then the aerosol cooling will probably be at the low end of expectations also.”
I could be wrong here, but I thought that TCR was a function of the direct GHG forcing from CO2 + all feedbacks (water vapour chief among them). I did not think that negative forcings from anthropogenic aerosols were included in this list of feedbacks; thus anthro aerosol forcing is effectively independent of TCR? Also, the TCR quoted is due only to CO2. All of the other contributing WMGHGs would also have their own separate TCR, no?
I have another caveat with regard to this attribution based upon line by line (LBL) analysis of GHG forcing:
“Forster et al. (2011a) evaluated global mean radiatively important properties of chemistry climate models (CCMs) and found that the combined WMGHG global
annual mean instantaneous RF at the tropopause is within 30% of LBL models for all CCM radiation codes tested.”
So, only accurate within 30% for measurements of instantaneous RF averaged over a period of a year or so. Extrapolating these results to a period of 250 years plus seems to me to be pushing the envelope somewhat (excuse the pun).
“Most intercomparison studies of the RF of GHGs are for clear-sky and aerosol-free conditions; the introduction of clouds would greatly complicate the targets of research and are usually omitted in the intercomparison exercises of GCM radiation codes and LBL codes (e.g., Collins et al., 2006; Iacono et al., 2008). It is shown that clouds can reduce the magnitude of RF due to GHGs by about 25% (Forster et al., 2005; Worden et al., 2011; Zhang et al., 2011)”
“We underscore that uncertainty in RF calculations in many GCMs is substantially
higher owing both to radiative transfer codes and meteorological data such as clouds adopted in the simulations.”
[Ref. IPCC Anthropogenic and Natural Radiative Forcing ch. 8 IPCC AR5]
So, a calculation of WMGHG forcings using radiative transfer codes may be sufficiently robust under controlled conditions, but variable meterological/climatological influences occurring over the entire period of 260 years for which the attribtution is quoted might reasonably be expected to incur a high degree of real world uncertainty. I think even the recent study claiming to have directly observed the GHG effect ‘in the wild’ was also carried out under controlled clear sky conditions.
Is this just the direct effect from the gases themselves or does this include feedbacks ( water vapour and albedo) as well?
If its just the direct forcing from the ghgs then presumably this number would double with the feedbacks?
The radiative forcing is due to the gases themselves. The assumed value for climate sensitivity accounts for all the feedbacks. So, if feedbacks are large then climate sensitivity is large and the warming is large, and vice-versa.
Ed.
(deltaT = deltaF [Wm^-2] x climate sensitivity [K/Wm^-2])
Ed,
What you write makes good sense to me, however I have a few comments:
1) The existence of internal variability obviously means that the forced warming could be higher or lower than observed warming, perhaps significantly. So your analysis can’t be seen as deriving a lower bound for TCR.
2) If the change in aerosol forcing since 1850 is in line with Bjorn Steven’s recent estimate then the change in total effective forcing from all sources from 1850 to now is very close to the greenhouse gas only forcing. This is based on AR5’s best estimates of all non-aerosol forcings and applying its estimated ~3x efficacy to black-carbon-on-snow forcing. (Using the AR5 aerosol forcing estimate would reduce the total forcing change estimate by under 10%.) So what you derive is close to being a best estimate of TCR.
3) If TCR is only 1.0 K, then from an energy budget analysis ECS (here effective climate sensitivity) will only be 1.2K, applying the formulae in section 10.8.1 of AR5 WG1, based on a 0.5 W/m2 change in the rate of increase in planetary heat content (say, from a 0.1 to 0.6 W/m2; the true increase may well be somewhat smaller).
1.2 K is far below the comparable CMIP5 mean effective climate sensitivity, of ~3.1 K.
Thanks Nic.
1) I agree – this calculation says nothing about bounds on TCR.
2) I think your statement makes assumptions about the efficacy of the (sulphate) aerosol forcing too? And, of course, your argument from (1) means you can’t derive TCR without knowing the net variability contribution either. It is the aerosol forcing that is key to more accurately estimating TCR.
3) For clarity, I think TCR is larger than 1.0K. Even if the total forcing is the same as GHG forcing then TCR=1.2K, assuming a net zero variability contribution.
cheers,
Ed.
Thanks, Ed.
I have taken the efficacy of all forcings other than black carbon on snow, relative to their ERF, to be one. AR5 doesn’t indicate a non unit efficacy for any of the other forcings. Hansen et al (2005) found sulphate aerosol forcing to have an efficacy marginally below one, IIRC.
If total forcing were the same as GHG forcing, then wouldn’t your estimate of TCR be 0.8 * 3.7/2.6 = 1.14 K? But using the Steven’s aerosol forcing estimate total forcing is slightly less than GHG forcing over 1850-2011 or similar, and the TCR estimate would indeed round up to 1.2 K.
Hi Nic,
I think I rounded up assuming the warming was a bit larger than 0.8, which it probably is.
So, do we agree that it seems hard to justify a TCR < 1.2K?
cheers,
Ed.
Something that strikes me about the whole attribution issue is that the basic physical processes that would contribute to internally-driven warming (clouds, water vapour,…) are essentially the same as those that produce the feebacks to anthropogenically driven warming. Hence if less than 50% of the warming since 1950 is anthropogenic, it implies that somehow these processes amplify internally-driven warming, but somehow don’t act as feedbacks to anthropogenically driven warming. Unless I’m missing something, this seems logically inconsistent.