The largest impacts of increases in temperature will not be experienced due to changes in the mean, but by changes in the extremes. This is illustrated using UK heatwaves to show that the number of days which will require preventative action will increase by roughly a factor of 6 for a 2ºC increase in summer temperatures.
Summer heatwaves can be extremely uncomfortable and even fatal, especially to the elderly. For example, an estimated 40,000 extra people died across Europe because of the extreme heat in the summer of 2003. Crop yields can also be affected by extreme heat.
The 2003 event prompted action across Europe to improve warnings and reduce vulnerability, which may have helped reduce the number of extra deaths during a heatwave in 2006.
In the UK, the Met Office operates a Heat-health Watch during summer which provides alerts to the relevant authorities when an extreme heatwave is forecast and subsequently occurs.
The temperature thresholds for alerts vary across the country. In the North East of England a daily maximum temperature of 28ºC and minimum temperature of 15ºC defines an extreme heatwave day. For the South East, the thresholds are 31ºC and 16ºC respectively, highlighting how previous experiences may have already helped people and infrastructure to adapt.
Both thresholds are important, but the number of extreme warm nights has increased far faster than the number of extreme hot days over the past 60 years for England & Wales (Figure 1).

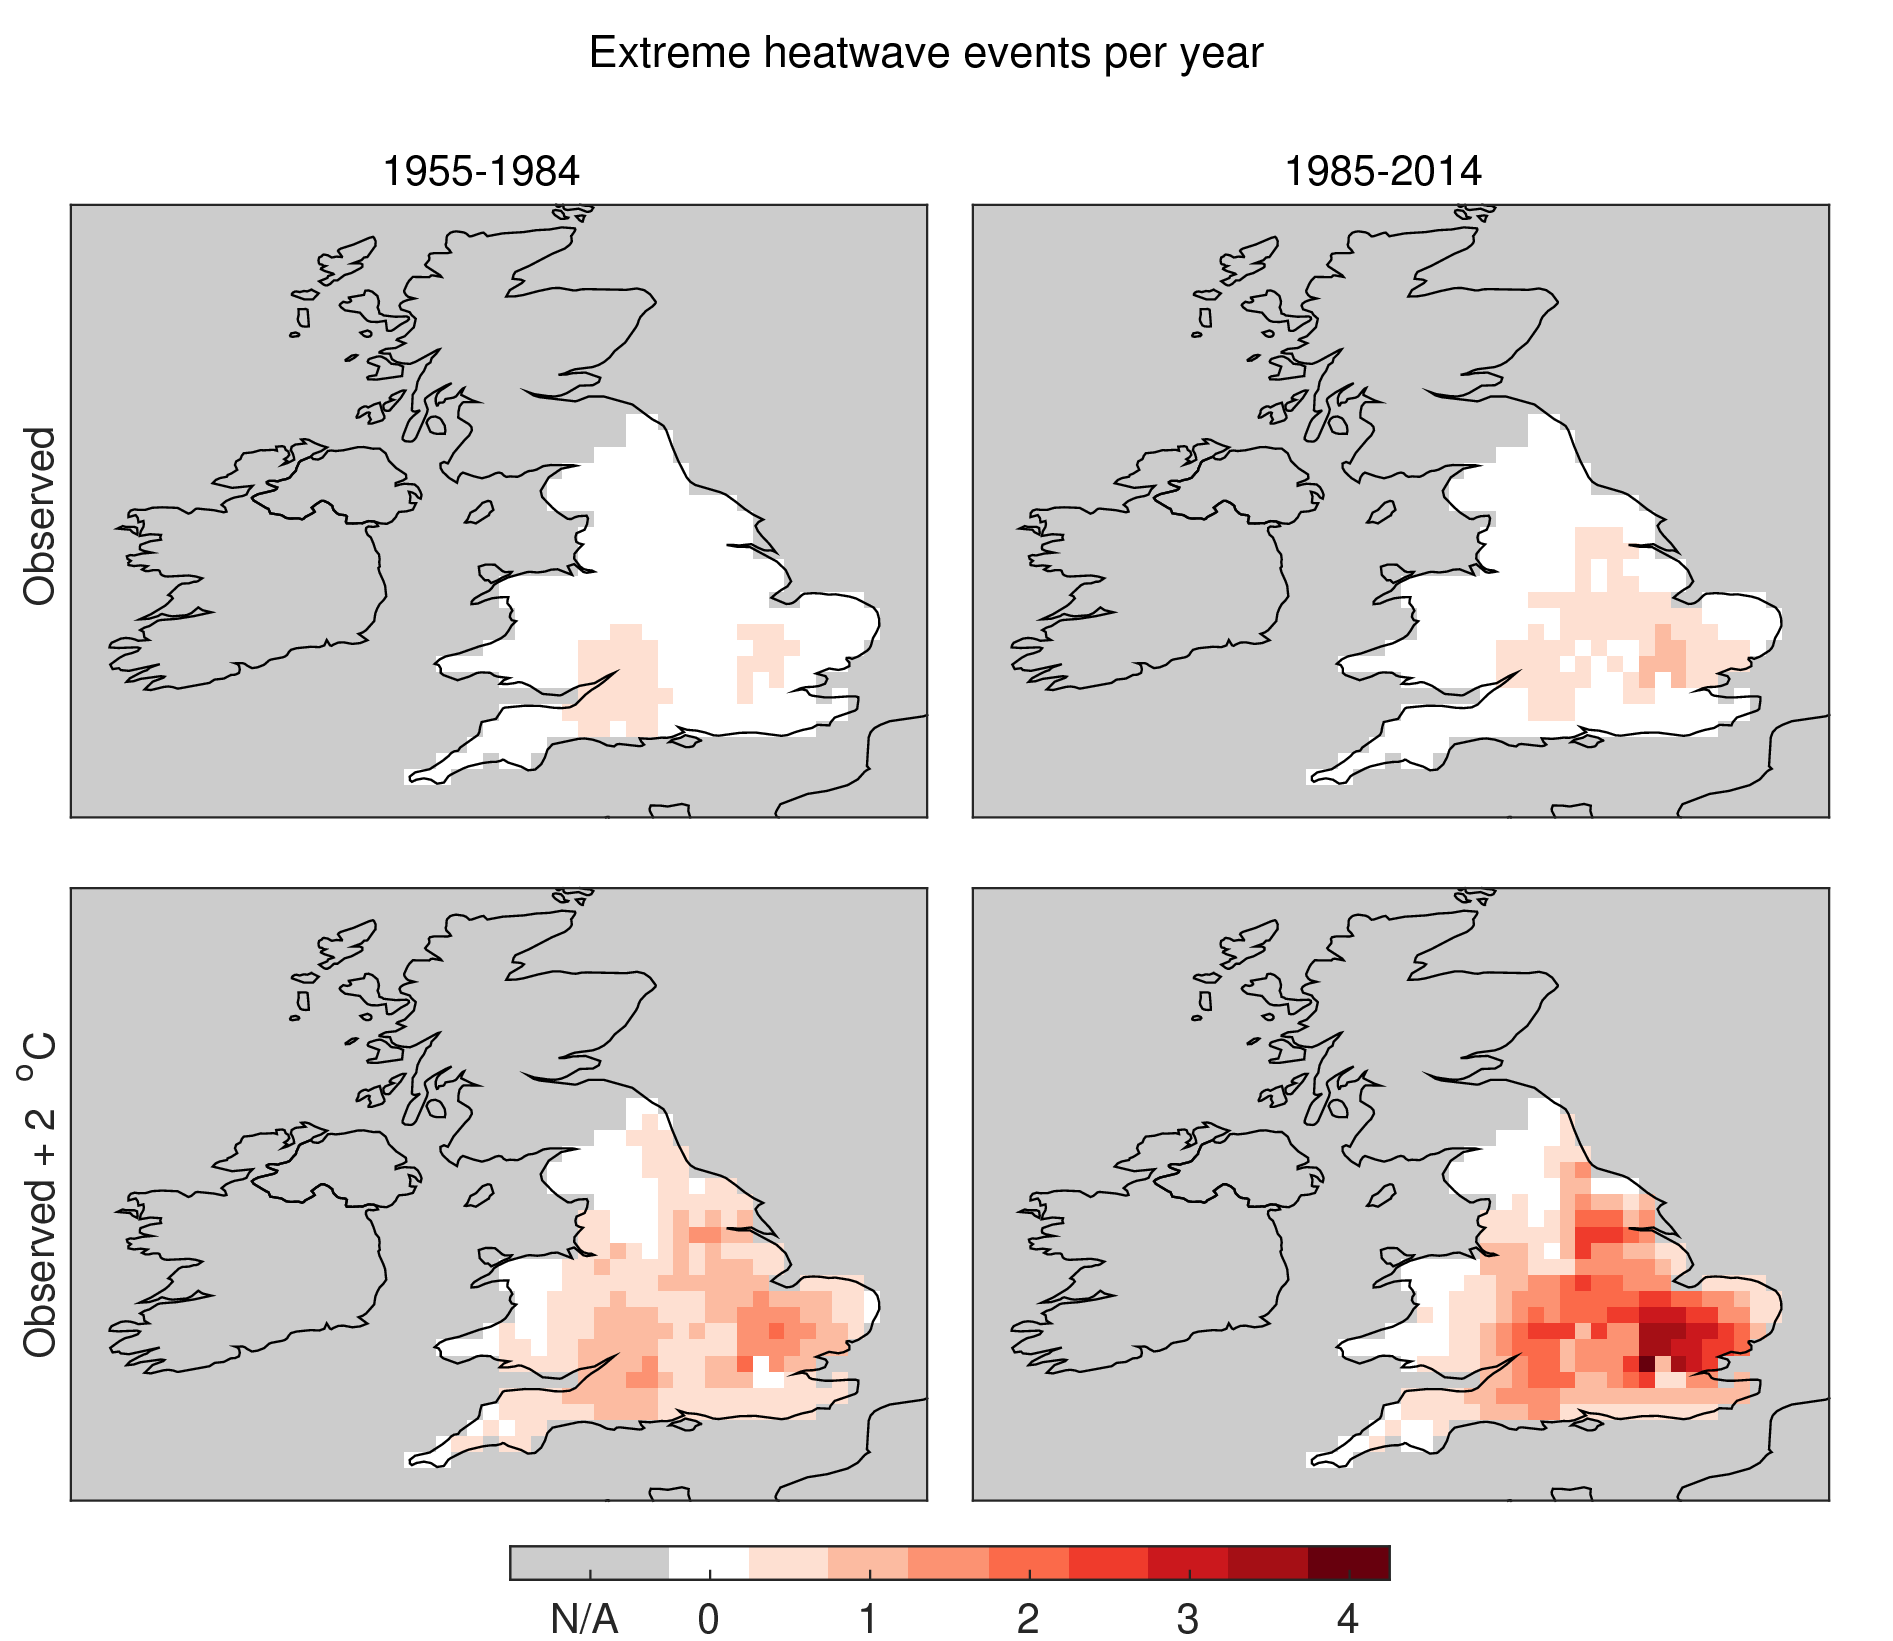
Using longer averages (30-years) and the combination of thresholds (i.e. both a hot day & warm night), an extreme heatwave event occurred roughly once every two years in some regions during the 1955-1984 period, and far less frequently for most of the UK (Figure 2).
More recently (1985-2014), the number of events has increased slightly, but is still less than once per year on average almost everywhere. It should noted that heatwave days tend to occur in batches (e.g. 1976, 2003 & 2006), rather than being more regularly spaced throughout the periods.
If temperatures increased by 2ºC everywhere (both day & night) – which might sound quite appealing – then the number of extreme hot events increases markedly (Figure 2) with many areas experiencing an average of 2-4 days per year on which preventative action would be required – an increase by about a factor of 6.
Note that this is an illustrative example with a number of caveats. Daily minimum temperatures are projected to continue to increase more rapidly than maximum temperatures. A 2ºC change in temperature would also likely be accompanied by a change in atmospheric circulation patterns, which might increase or decrease the number of extreme heatwave situations. The projected decrease in rainfall in spring & summer might increase the chances of heatwaves as the soils will be drier.
An increase of 2ºC is projected to occur around mid-century for the RCP8.5 emissions scenario (which assumes no climate mitigation), and around the 2080s for the RCP4.5 emissions scenario which does include some climate mitigation. Whether such a change will end up causing more fatalities depends on how well we can adapt to the heat.
Notes: This analysis uses the E-OBS dataset. London experiences less extreme events because the warning thresholds there are set as 32ºC (max) and 18ºC (min), which occur less frequently. Whether this is appropriate, or perhaps an artefact of the gridded dataset used, rather than station data, might be worth considering further. Also note that Scotland and Northern Ireland are not part of the Met Office warning system and do not have defined temperature thresholds.
Also see: James Annan discusses the issue of heat mortality. And, there has recently been some debate over whether flu or cold weather is the major determinant of mortality rates in UK winters.
Thanks to Richard Betts for useful comments.
The latest Rahmstorf paper has been said to suggest that a slowing of the Gulf Stream due to Greenland ice-melt runoff, is likely to slow down warming in Western Europe. Is this likely to be reflected in a reduction in these extreme heat events for the UK?
Hi John,
Thanks for the comment. The AMOC is projected to slow down in the simulations so this is already reflected in GCM projections of UK temperatures. I deliberately chose not to use the simulated data in the analysis, and just concentrated on the idealised case of a 2C warming.
Of course, the AMOC might slow down more rapidly than the models suggest which would reduce the number of UK heatwaves. But, there are a number of very large caveats in the Rahmstorf et al. study which have been largely ignored in the media coverage of it.
cheers,
Ed.
Ed my own experience of a UK heatwave was the summer of 1976. I’m pretty sure that the AMO was in its negative phase at that time.
Hemispheric weather patterns are coupled also to ocean sst patterns. They are interdependent.
Given it was Kevin Trenberth that said some years ago that GCMs don’t handle “ocean variability” very well and are not initialised to the current state of the oceans. Can we actually say much about future extreme events such as 1976 until we start to improve the models in this area?
Stephen – the analysis above does not use any model simulations. It takes the observed temperatures and simply adds 2ºC onto every day and night to illustrate the effects of that increase in temperature. It also highlights the large increase in night time temperatures which has been observed already over the past 60 years.
cheers,
Ed.
Thanks Ed I can understand your methodology for illustrative purposes in relation to the “sociology of heatwaves” as it were. It was rather the explicit reference to models ;
“An increase of 2ºC is projected to occur around mid-century for the RCP8.5 emissions scenario (which assumes no climate mitigation), and around the 2080s for the RCP4.5 emissions scenario which does include some climate mitigation. Whether such a change will end up causing more fatalities depends on how well we can adapt to the heat.”
It was in the light of reference to the AMOC in your reply to John that prompted my comment on the 1976 heatwave during a “cool” AMO phase.
All I’m really saying is heatwaves are “weather events” the attribution of which depends on understanding a multitude of interdependent drivers.
The 1976 record heatwave occurred during a very different “scenario” from those we are envisaging.
That said point taken 😉
Bests,
Stephen
I’m not quite following why one would “simply add 2ºC onto every day and night [temperature].” The 2ºC figure, which you say is predicted for mid-century for the RCP8.5 scenario, is the change from pre-industrial (or perhaps 1850-1900). We currently stand at about 0.9ºC for this metric. So shouldn’t one be adding 1.1ºC to recent temperatures, and perhaps 1.5ºC to slightly older ones?
Hi Harold,
The 2C I used was for UK temperatures above now – chosen as a convenient illustration.
It has nothing to do with the global 2C threshold which policymakers are concerned about.
cheers,
Ed.
“. But, there are a number of very large caveats in the Rahmstorf et al. study which have been largely ignored in the media coverage of it. ”
That’s putting it rather kindly 😛
Ed, what are the caveats that you had in mind in respect to the following statement in Rahmstorf et al 2015:
It surprises me that there is no pushback within the “climate community” against the idea that Finnish sediments contaminated by agricultural runoff, stripbark bristlecone pine chronologies, tree ring density chronologies truncated to hide the decline and hundreds of nondescript tree ring width chronologies can be used to not only to reconstruct Northern Hemisphere temperature, but Southern Hemisphere temperatures and a single component of Atlantic ocean currents.
To claim that “p>0.99” for a reconstruction from such improbable components says nothing about the probability of the reconstruction, but the invalidity of their statistical procedures, caveats on which were not reported by the media, at least in part because they were not reported by the authors.
Hi Steve,
I think there are many caveats on Rahmstorf et al which were not reported by the media, although I am no expert in using proxies or in Greenland melt rates. But, to my mind, the uncertainties are vastly underestimated.
I am skeptical of the reconstructions for the reasons you give. It also seems odd to use the same proxies with different weights to reconstruct both NH temperatures and Atlantic SPG temperatures, and then claim that the difference is entirely due to the AMOC (as I understand it). However, there is a good physical basis for expecting a relationship between the Atlantic SPG temperatures and the AMOC strength. There are undoubtedly interesting mechanisms to understand in the Atlantic SPG – it is a region which has not warmed, and exhibits substantial multi-decadal variability which becomes less visible in the reconstructions, especially pre-1500. The direct RAPID observations of the AMOC at 26N show a large decline over the past 10 years (-0.4 Sv/year), but whether this is due to radiative forcings or variability, or a combination is not yet clear. It seems odd that those results are not plotted in Figure 5 but the previous ship measurements at the same latitude are.
I have spoken to several colleagues who have significant doubts about the strength of the conclusions of the paper – I believe there is more healthy skepticism than may be visible from outside the community.
cheers,
Ed.
Hi Ed, I saw on your publication-list a paper in review: “Rodriguez, Wood, Smith & Hawkins, ‘Will global warming bring the Atlantic overturning circulation closer to a threshold?’, Geophys. Res. Lett.”
It’s an respond to S.R. et. al (2015)? Some suspense here 🙂
best
Frank
Hi Frank – not a direct response to Rahmstorf et al, though relevant to that discussion. Paper was actually submitted more than a year ago, but lead authors still finalising some details on the revisions. Hopefully will be out soon so that all can see – and there will be a blog post of course! 😉
cheers,
Ed.
Ed,
I think you may exaggerating a non-problem as far as the UK is concerned. Even if global temperatures rise by 2C, the net effect on heatwaves in the UK will be minor. After all, the majority of the Australian population are of British origin and heat-waves over 40C for weeks on-end are common mainly because the sun is closer to the earth in SH summers. Australians seem to cope rather well.
By far the strongest heatwave the UK experienced in recent decades was in 1976.
Lets keep things in perspective so far as the UK is concerned.
Hi Clive,
I have taken the heat thresholds as defined by the NHS/Met Office/other bodies as they realise that there is a significant increase in risk of mortality at those temperatures, based on data from past heatwaves. Your reference to Australia is irrelevant to how the population in the UK responds to the hot weather, *relative to what they are used to*.
Yes, summer 1976 was hot, as was 2003 and 2006. But, it is also the night time temperatures which are important as they usually allow people to cool down. Minimum temperatures are observed to be increasing far more quickly than maximum temperatures.
cheers,
Ed.
Ed,
Humans evolved in Africa and were obviously naked. The easiest adaptation against climate change in the UK would be to wear lighter clothes. It really is that simple. I lived 20 years in Italy where average temperatures are > 5C more than the UK. Old people simply are not dropping dead in the street.
Hi Clive,
So why did 40,000 extra people die in 2003? It is because the temperatures they experienced were far outside their normal comfort zone.
Ed.
40,000 extra deaths in Europe is an estimate for 2003. The extreme heat was mainly in southern France and Mediterranean countries, rather than the UK. Is there any evidence of an increased death rate for the UK? The population of Europe is 500 million so the annual death rate is about 6.6 million/year or roughly 3 million each summer. Therefore the increase in death rate was only around 0.1%.
I am sure you are right that there will be more ‘heat-waves’ in the future in the UK. It is just that I don’t believe it will bring any direct problems to the UK itself. It probably will cut down on package holidays to Spain. That is if we are still allowed to fly by then!
The office for national statistics quotes: ‘An estimated 31,100 excess winter deaths occurred in England and Wales in 2012/13 – a 29% increase compared with the previous winter.’
So presumably some proportion of those excess deaths due to cold weather will be saved in the future.
Hi Clive,
It is not clear whether excess winter deaths are due to the cold weather or flu – see the linked discussion in the ‘See Also’ section of the blog post. It is not as straightforward as you assume. We have adapted to cold weather a lot already, with better home insulation etc.
And, the heatwave concerns are not just about health. Some roads and railways in the UK were disrupted in 2003 because of the heat. We are adapted to our current climate in many ways – and changes in the climate, especially the extremes, will therefore have consequences.
cheers,
Ed.
Australians are geared up for heat. Having spent time in 45 degree heat in Australia and the Northern Cape of South Africa I know that they only way Europeans manage to live comfortably in those temperatures is by making extensive use of air conditioners in their vehicles and homes. Almost every bedroom has a 5 kilowatt A/C unit built into the window, which is run all night while they sleep (because they don’t even know what insulation is). I was a young man in 1976 and I clearly remember how uncomfortable it became each night. It must have been much worse for the elderly.
Clearly when this becomes a problem we could equip ourselves with A/Cs, but I guess the power supply would take quite a hit and it would worsen the problem of emissions. In other words, a vicious circle. Just how far do we want to push our luck?
Almost everywhere has A/C in southern California. If people feel they need it in the UK, then you have to install and fuel it ($3k installation is the average US price, apparently), then power companies have to run peaker plants which drives up electricity prices for everyone. As usual, the poorest have to commit a higher proportion of income to adapt, or just suffer.
Ed: a few quick questions: what was your baseline period from which you measure the 2 C increase? Is your RCP 8.5 time estimate based on UK, global or land temperatures? Is there a similar analysis for cold periods?
I’d be interested to see how much warming it would take to make the increase in dangerously hot days outweigh the decrease in dangerously cold days.
Hi Mark,
No baseline – just an illustrative example of what happens if you increase temperatures by 2C from the two historical periods.
The RCP estimates are for the UK land temperatures, and I haven’t looked at cold periods, but the ‘Also see’ section in the post has a link to a recent debate in the literature about the causes of UK winter deaths – it is not clear whether flu or cold is the dominant factor at the moment.
cheers,
Ed.
In 2003 2300 extra people were recorded dying – the only year when summer deaths were high enough to record.
In contrast Irish research indicates 37,000 extra deaths in the winter. [snip – is there a link?]
I make the level of summer deaths 0.23% of the winter deaths.
Now call me fussy, but I think the 1million is a far more important number.
I presume the implication here is that warmer weather will result in fewer winter deaths?
This question was considered in a paper published last year which concluded
We found that the association of year-to-year variation in EWDs with the number of cold days in winter ( <5 °C), evident until the mid 1970s, has disappeared, leaving only the incidence of influenza-like illnesses to explain any of the year-to-year variation in EWDs in the past decade. Although EWDs evidently do exist, winter cold severity no longer predicts the numbers affected. We conclude that no evidence exists that EWDs in England and Wales will fall if winters warm with climate change.
http://www.nature.com/nclimate/journal/v4/n3/full/nclimate2121.html
What’s more, looking at the wider picture, there is no correlation (in Europe anyway) between countries with colder climates and increased levels of winter deaths, in fact if anything the opposite is true.
http://m.eurpub.oxfordjournals.org/content/early/2014/06/11/eurpub.cku073
EWD kill the elderly. If you want to study the fact properly, you need to take into account life expectancy.
If life expectancy in U-K (or Germany) was higher than in Spain (or Italy), maybe “the opposite is true” would no longer be.
By the way, big flu this winter in France, 10000 excess mortality (70000 in Europe). The flu began in mid January, with a cold snap Meteo France tell me. I’m not surprised, every year INSEE (french statistic bureau) link excess mortality with colder than usual winter.
Hi Ed,
About 75% of the increase in UK temperatures since 1956 can be explained by a decrease in cloud cover. Most likely this is due to cyclical changes related to AMO. There is a quite remarkable coincidence between maximum temperatures and average sunshine hours for 23 Met Office stations covering more than 50 years. Myself and Euan Mearns did a detailed study on all this which we reported in UK temperatures since 1933 – Part 2. We also wrote a paper and submitted it to Nature, but It was rejected. The results still stand however.
The best fit was to a cloud and CO2 forcing model with TCR = 1.2C. In 1956 the clean air act was introduced to reduce smoke pollution in cites so the sunshine/cloud data pre-1956 are not reliable.
——–
Another interesting comparison for extreme weather events is to look at the Met Office’s own records. Here is a compendium
http://clivebest.com/blog/wp-content/uploads/2012/12/All-records.png
It does not appear that any night time temperature records have been set recently. Look at highest daily minimum records.
cheers
Clive
Clive,
Looking at CMIP5 mean surface downwelling shortwave vs. tmax for grid boxes relating to the UK I find an r^2 score of 0.84. It’s simply an expected result to find co-variance in these datasets. There is also a 6 W/m2 increase in surface downwelling shortwave from 1956-2015 in the CMIP5 mean.
Is this CMIP5 increase of 6W/m2 due to a decrease in aerosols in the models ?
What emerges from analysing 23 Met Office UK weather stations is that maximum temperatures rose by about 1C since about 1960. This correlates with a small rise in average sunshine hours or put another way – less clouds. This trend reversed slightly since 2003, although 2014 was warmer because of the mild winter.
http://clivebest.com/blog/?p=6385
You’ve described how the threshold varies spatially, does it vary temporally? For example would the threshold in the NE be the same in 1950 and 2015?
Related to this what are the factors that determine the threshold temperatures?
Hi HR,
Good question. The threshold has only been fixed recently when the UK warning system started. You might imagine that in a warming climate the thresholds might increase if hot temperatures become more common and we can successfully adapt.
cheers,
Ed.
Exactly, I do imagine that there are many societal (and climate) factors that have changed since 1950 which mean resilience to heatwaves has increased from personnel habits to population health to work practises to improved building practise to many more. I guess the problem I have is that your figure 1 may be telling us very little about how changing extremes may be affecting populations.
Ed, I’m a bit stuck on the Note as it seems to be putting the cart before the horse:
“London experiences less extreme events because the warning thresholds there are set as 32ºC (max) and 18ºC (min), which occur less frequently.”
It’s the ‘because’ that seems wrong. Presumably the thresholds are set because they’ve been reached before. If they’re being reached infrequently then that’s an observable fact. Shouldn’t the Note just say:
“London’s thresholds are 32 max and 18 min. Extreme weather events there are infrequent.”
It isn’t that the thresholds are high that explains infrequent extreme weather events. It’s the weather not reaching those thresholds. Or are you arguing that thresholds should be lowered so that more frequent extreme events could then recorded?
Hi WB,
I’m not entirely sure why the London thresholds are so much higher – maybe other readers can help? My initial (naive?) thought was that everywhere might have similar numbers of extreme events (in some historical reference period) as these events are all then equally unusual compared to the local climatology, and therefore what the area may be adapted to. There is an urban heat island (UHI) in London which means temperatures there are higher, so the thresholds should then be higher. But, also I am not certain whether the gridded dataset I was using captures the London UHI fully as there is some interpolation between stations involved in its construction. This may affect the number of diagnosed events.
cheers,
Ed.