Category Archives: visualisation

A world before ice

The Earth hasn’t always been struggling with global warming. Around 34 million years ago at the Eocene-Oligocene Transition (EOT) the Earth was undergoing a period of global cooling. This significant shift in climate led to the formation of the first permanent ice sheets of the Cenozoic Era over Antarctica, as shown by the dramatic shift (in a geologic sense) in the oxygen isotope records [1]. The cooling, likely a result of declining atmospheric carbon dioxide levels but potentially also coinciding with Southern Ocean gateway changes, turned Antarctica from a green forested continent to the land of ice we know today. This is illustrated with an image of how this world might have looked.

Guest post by Alan Kennedy, University of Bristol Continue reading A world before ice
New viridis colour scale

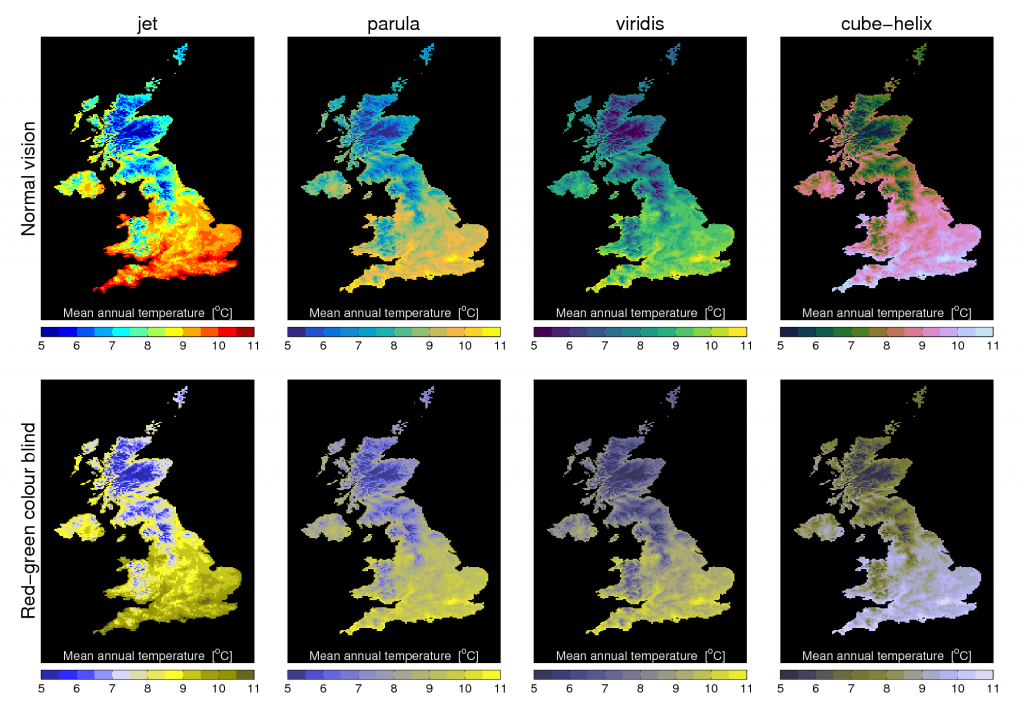
Below is a simple example of using different colour maps to show the same UK mean temperature data for both normal vision and a simulation of colour blindness.

Viridis is a new colour map developed for Python (MATLAB code here) with lots of nice features, including removal of artificial perceptual boundaries which jet suffers from.

Which do you prefer?

UK mean temperature, shown for four different colour scales, for both normal vision (top) and a red-green colour blind simulation (bottom).

[This post continues our #endrainbow campaign to reduce use of ‘rainbow’ colour scales like jet.]

Reinventing the colour wheel

Between 5-10% of men and around 0.5% of women are affected by various forms of colour blindness. The most common form is deuteranopia, for which distinguishing between red and green is particularly challenging. This has been pointed out many times before, but it may be worth remembering next time you make a figure or visualisation: ‘red and green should never be seen’.

[Part of the #endrainbow campaign.]

Colour wheel for normal and simulated deuteranopic vision. Click for larger version.