As the annual September sea ice minimum in the Arctic approaches, the usual questions arise about whether this year will set a new record for the extent or volume of ice left at the end of the summer. Although there was a new winter record low in 2017 it is looking unlikely that the summer will also set a record for extent, but there is still a month to go.
We understand that sea ice melt is erratic – we should not expect new records every year, but the overall trend is towards less and less ice. But, what about looking further ahead? And, can we understand sea ice variations during the historical period?
Mahlstein & Knutti (2012) suggested that there was an approximate linear relationship between global temperature change and Arctic sea ice area decline, and inferred that the Arctic would be effectively ‘ice free’ (<1Msqkm) at around 2C above pre-industrial levels, with some uncertainty. However, the observed relationship looked suggested faster melt than in the simulations from CMIP3. [Note comment below by James Screen on this paper.]

Now we have longer estimates for both global temperatures and Arctic sea ice and newer simulations. Notz & Stroeve (2016) recently suggested that there was a linear relationship between cumulative carbon emissions and Arctic sea ice. They found that each metric tonne of CO2 emitted caused around 3m2 of sea ice area to melt.

Can we go back even further to see whether these simple linear relationships hold? Recently, Walsh et al. (2017) published an Arctic sea ice dataset from 1850-2013. Note that the amount of data going into this dataset reduces significantly further back in time so there will be large uncertainties in the extent values.
However, this dataset can be used to examine how Arctic sea ice and global temperatures have evolved together over the past 164 years. As global temperatures have increased (upside down in the figure below), the extent of Arctic sea ice in September has declined.
What is striking when comparing these indices, which are constructed entirely independently, is their agreement on the long-term trends and multi-decadal fluctuations, especially from 1910 onwards. However, this relationship appears to break down from 2007, which was a record low in the observations at the time.
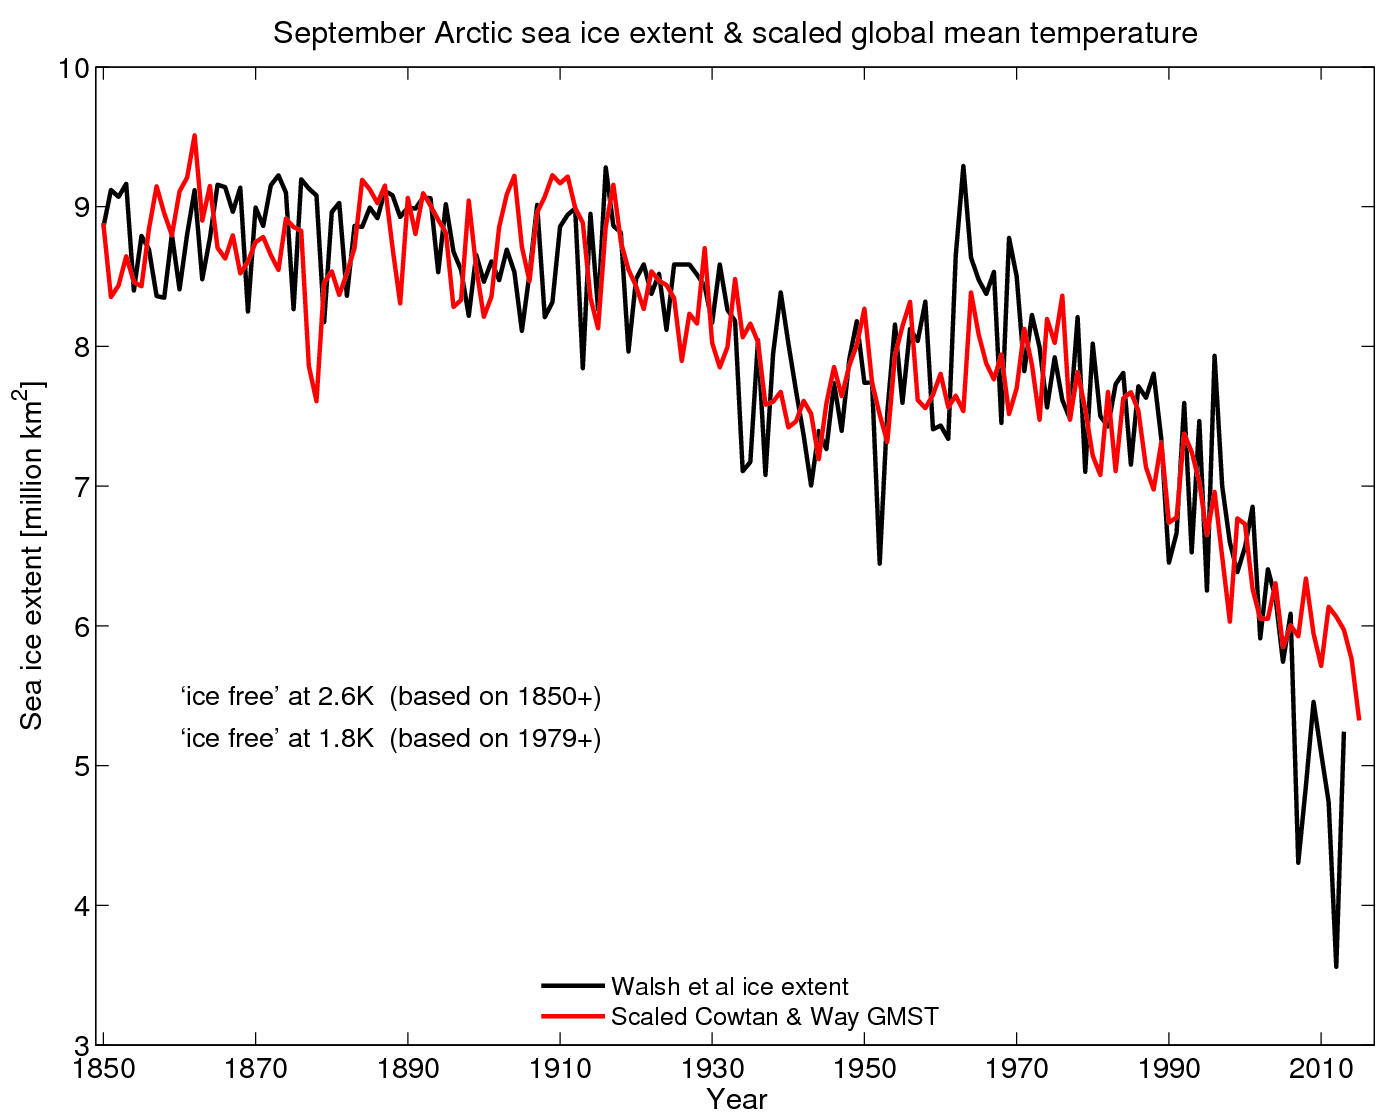
There are several possible explanations for this divergence after 2007. (1) The sea ice observations further back in time are too uncertain. (2) There is a real acceleration in sea ice loss per degree of global warming. (3) A large internal variability fluctuation has caused the Arctic sea ice to melt more than expected from 2007 onwards.
Which is right? I suspect a combination of factors. Note that Arctic Amplification does not necessarily explain this feature, unless the amplification factor has also changed over time.
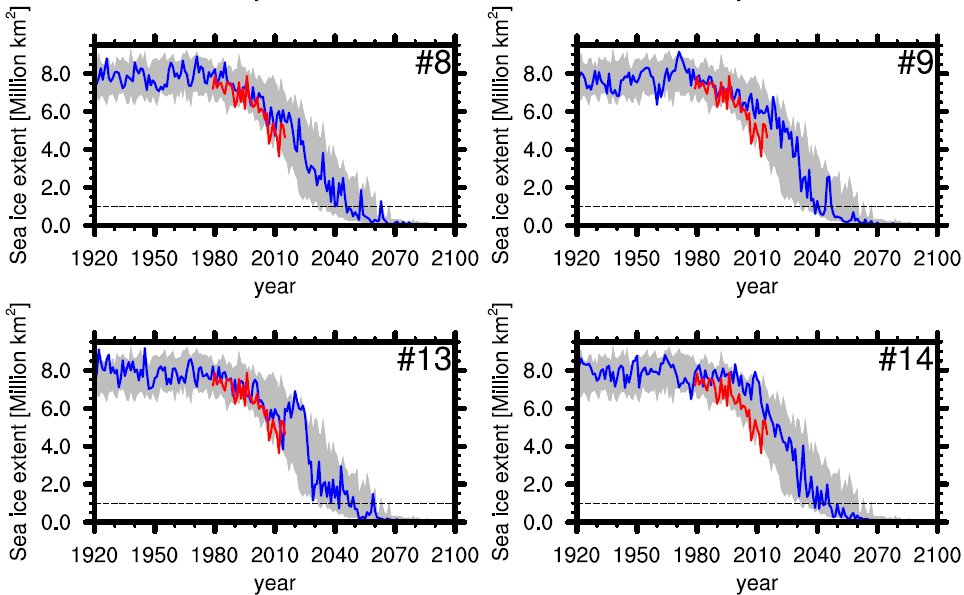
To demonstrate that (3) is at least a possibility, the figure below from Jahn et al. (2016) shows four simulations with the CESM GCM with the same radiative forcings. The only difference between the simulations is the internal variability.
Realisation #13 follows the observations quite closely but then shows a large increase in sea ice, before rapidly declining again. Realisations #9 & #14 are towards the upper end of the range before declining more rapidly. These examples highlight that climate simulations do show significant natural fluctuations in sea ice extent, on top of the long-term decline.
However, GCMs show a large diversity in the simulated amplitude of sea ice variability, as shown in Swart et al. (2015). And, it is not necessarily the most variable in global temperature which show the largest sea ice variations.

Decadal variations in sea ice have been explored in detail in one model (GFDL CM2.1) by Zhang (2015) which discusses the important role for oceanic and atmospheric heat transports, but more research in this area is needed.
Overall, Arctic sea ice trends are strongly related to changes in global mean temperature. There are hints that the ice may be becoming more sensitive to temperature in the observations, but this is not clear in the GCMs. Our simulations show large internal variations in sea ice which we need to better understand and examine whether the same mechanisms may be working in the real world.
Imagine if the real world behaved like realisation #13 from the CESM ensemble?
Ed, perhaps a minor point but the Mahlstein & Knutti (2012) paper projected ice-free conditions at 2C above present-day (1980-99) not 2C above pre-industrial.
However, Rosenblum & Eisenman (2016) found some apparent errors (or at least sensitivity to methodological choices) in Mahlstein & Knutti (2012). They suggest the number should be 1C above present-day (1980-99); so 2C above pre-industrial might be about right, but that was not what was reported in Mahlstein & Knutti (2012)
Thanks for the clarification James – have added a note in the text!
Ed.
Ed, you haven’t mentioned a recent review of exactly these issues (Connolly, 2017, http://www.tandfonline.com/doi/abs/10.1080/02626667.2017.1324974 ). There is considerable sensitivity to datasets included, and evidence of greater variability in some datasets.
The data for these past 10 years appears to contradict your interpretation. Since 2007 there hasn’t been any decrease in Arctic sea ice September extent. This year it also looks now that it will be above 2007 levels. That’s 10 years of no decrease. So the relationship broke down in the opposite direction you suggest. Since 2007 Arctic sea ice is not decreasing despite increased warming (2016 was record warm year and 2017 could be top second), and increased CO2 (10% of emissions these past 10 years).
Other researchers like Miles et al., 2014 and Wyatt & Curry 2014 have suggested Arctic sea ice changes correlate with AMO a lot better than with CO2 or global average surface temperatures.
Hi Javier – I disagree. You are starting from 2007, which was an exceptionally low point due to the extreme weather than summer. If you take the longer term view as in the graphics above, then the sea ice is below where you might have expected given the changes in global temperature. As the post discusses, this is either a real change in ice sensitivity, or a demonstration that what we are seeing from 2007 onwards is due to natural variability, or a combination.
Ed.
However the evidence is obstinate. A (4th grade) polynomial adjustment to September ice extent shows clearly that the melting these last years has been lower, not higher, than the melting in the late 1990’s – early 2000’s. Without picking any start date.
http://i.imgur.com/7CvjNdN.png
Arctic sea ice extent recent decrease in rate of melting does not correspond to a decrease in the rate of warming or CO2 increase, demonstrating that the issue is a lot more complex than thought and that the predictions for an ice-free Arctic are based on incorrect assumptions.
I prefer to think physically rather than fitting arbitrary curves through data. But, in any individual year or decade there might be apparent changes in direction of melt rates. This is expected. It is the long-term trajectory that is important and we are seeing an overall decline in Arctic sea ice as global temperatures increase, largely due to greenhouse gas emissions.
Yes. I also like to think physically. What do you think is more important to melt the ice, the temperature of the air above, or the temperature of the water below? What happens to ice when those temperatures are trending in opposite directions?
While HadCRUT4 Arctic air temperature 70-90°N shows warming:
http://www.climate4you.com/images/70-90N%20MonthlyAnomaly%20Since2000.gif
Argo ocean temperature change from 2004 to 2017 in the Arctic oceans, 55N-65N, 0-360E, shows a 0.5°C cooling:
http://www.climate4you.com/images/VerticalTempChangeArgoArcticEquatorAntarcticOceansSince200401%2065N-65S.gif
Now I would think “physically” that the polar air contains very little heat due to having very low water vapor, while the Arctic water has a huge heat capacity many times that of the atmosphere. Also due to heat transfer water is a lot more efficient than air at melting ice. Thus the reduction of Arctic water temperature must be a lot more important to sea ice than the increase in Arctic air temperature. Don’t you think?
That physical explanation would also refute your hypothesis while supporting the hypothesis of Miles et al., 2004.
Miles, M. W., et al. “A signal of persistent Atlantic multidecadal variability in Arctic sea ice.” Geophysical Research Letters 41. 2 (2014): 463-469.
Årthun, M., et al. “Skillful prediction of northern climate provided by the ocean.” Nature Communications 8 (2017), have used ocean temperatures to predict the continuation of the Arctic sea ice increase that you fail to see in the data towards 2020. Perhaps by then you will see that your hypothesis is incorrect.
It’s a bit hard to grasp in 2017 that melting sea ice and extent appear in the same sentence. Dropping all other physical parameters hints at some WYSIATI bias at work. Looking at volume and age the story is different and conclusions won’t come that easily. Extent is pleasantly reassuring, because it can’t tell how close a season ended to zero km².
Latest research indicates circulation and thus drift changed a lot. It’d be interesting to know whether models (can) pick up these new interaction patterns.