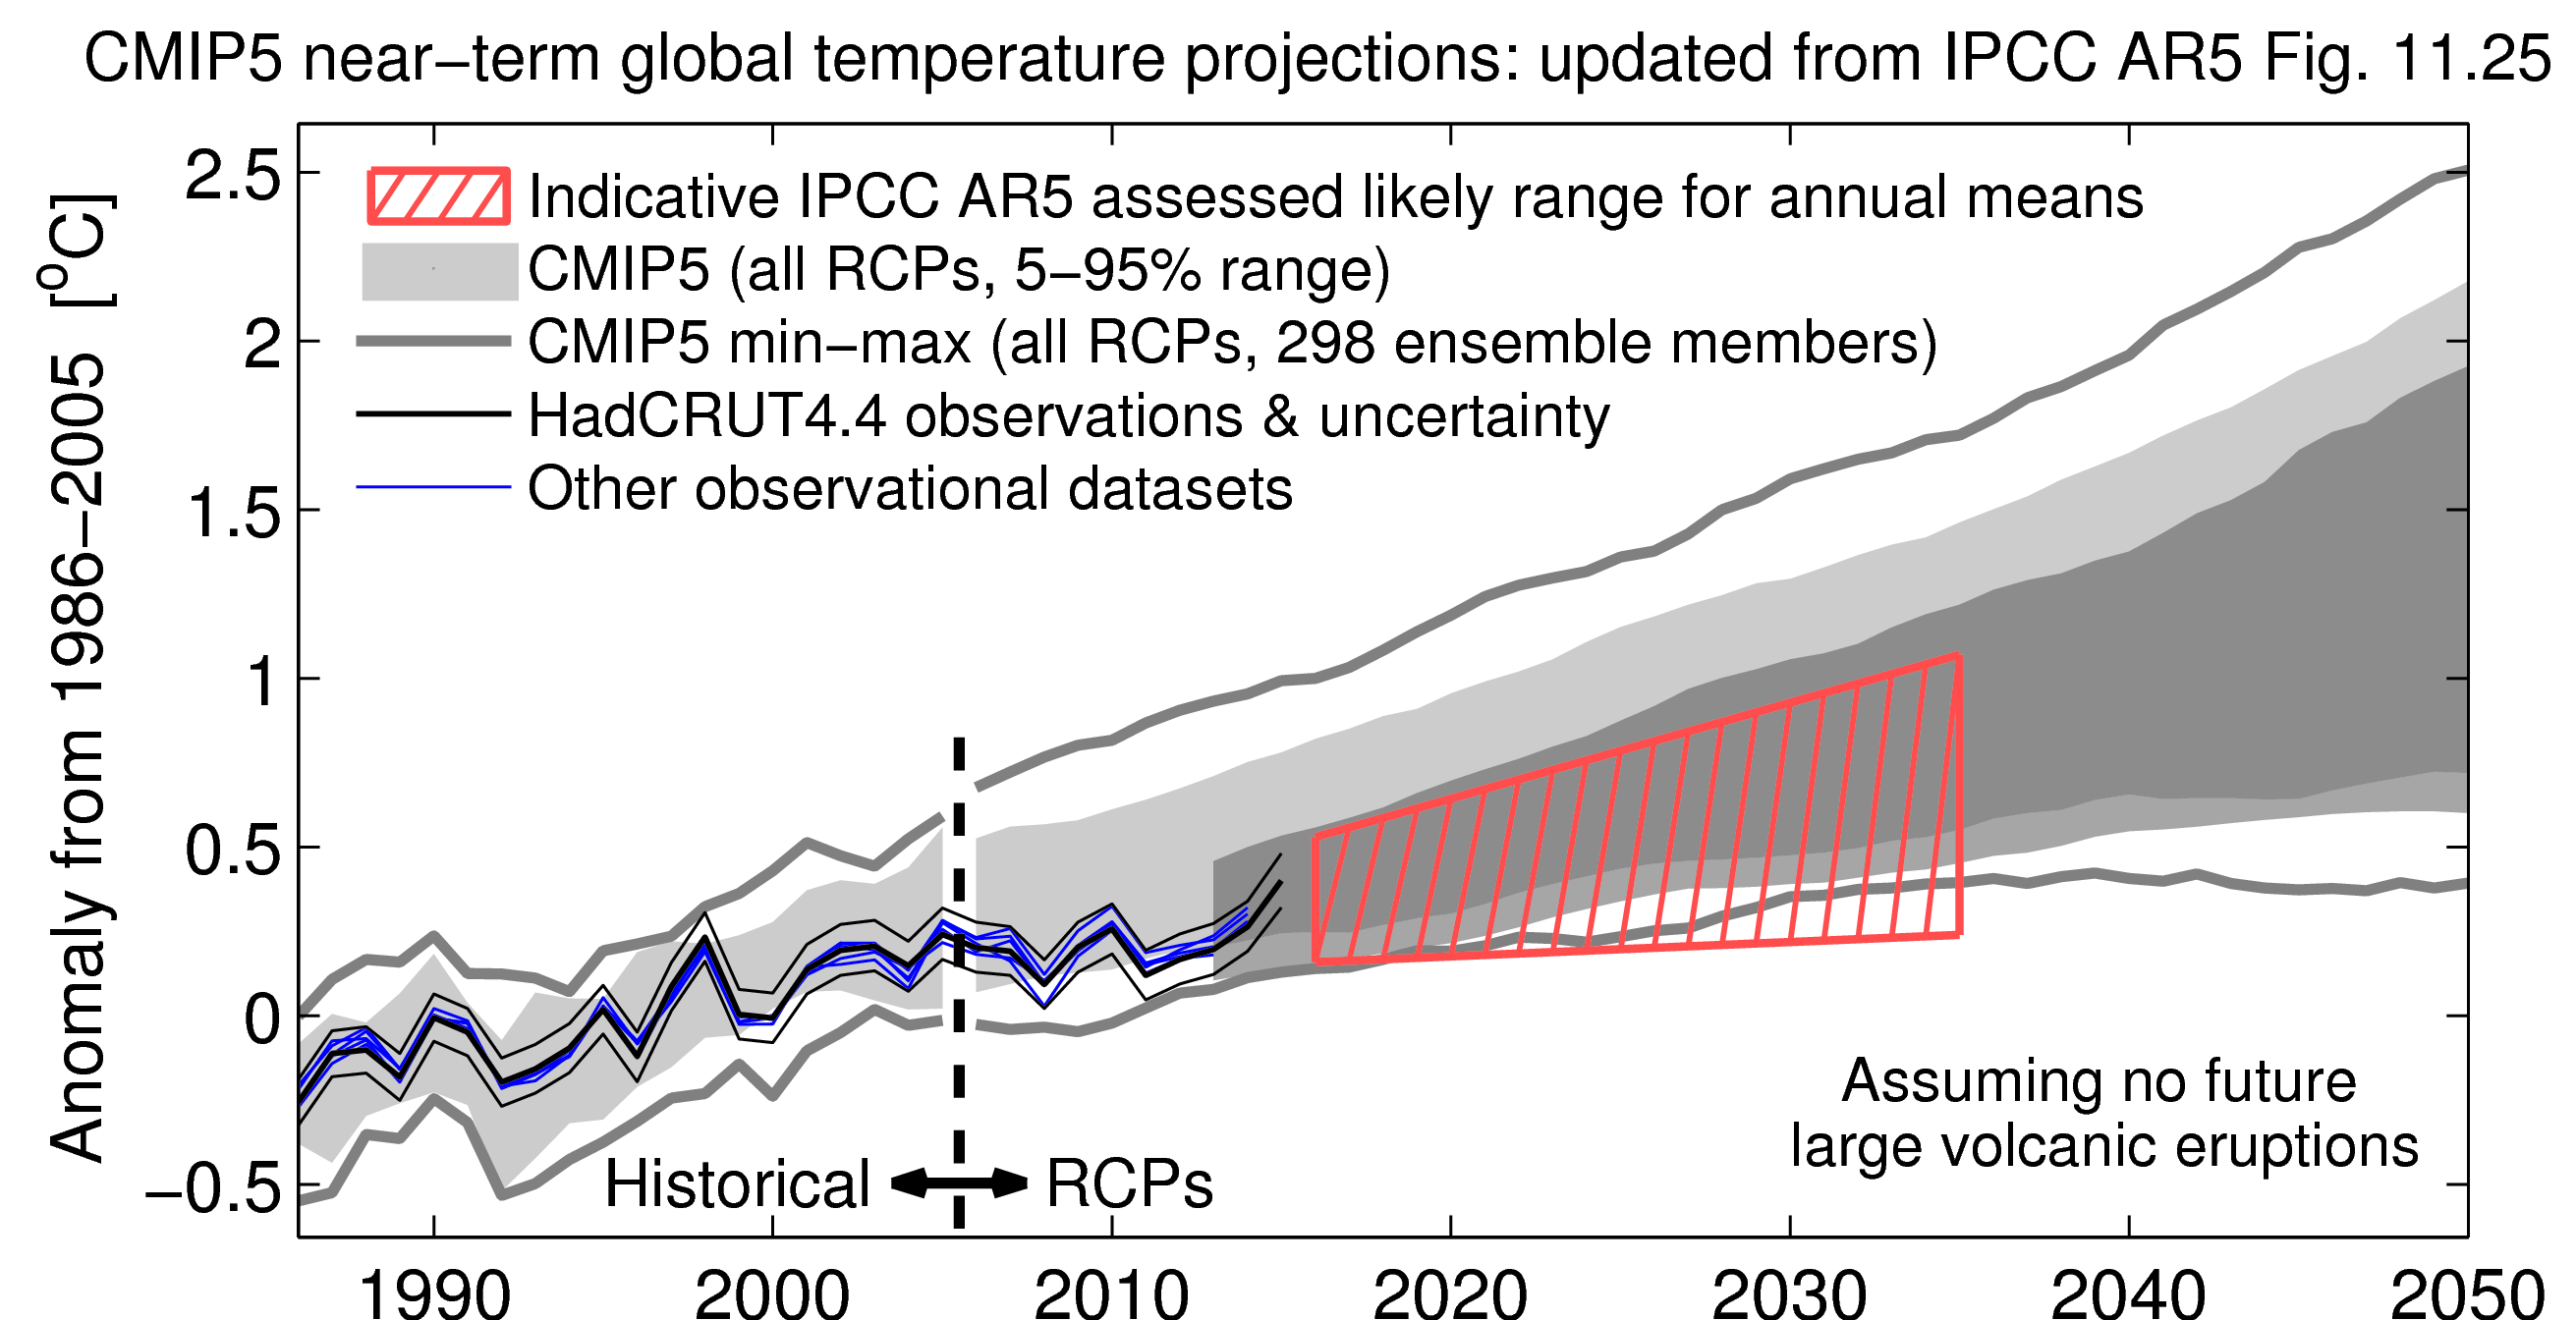
How will global temperatures evolve over the next 20 years? The IPCC AR5 made an assessment that average global temperatures in the 2016-2035 period would likely be 0.3 – 0.7°C above the 1986-2005 average. Some climate scientists disagree with that assessment.
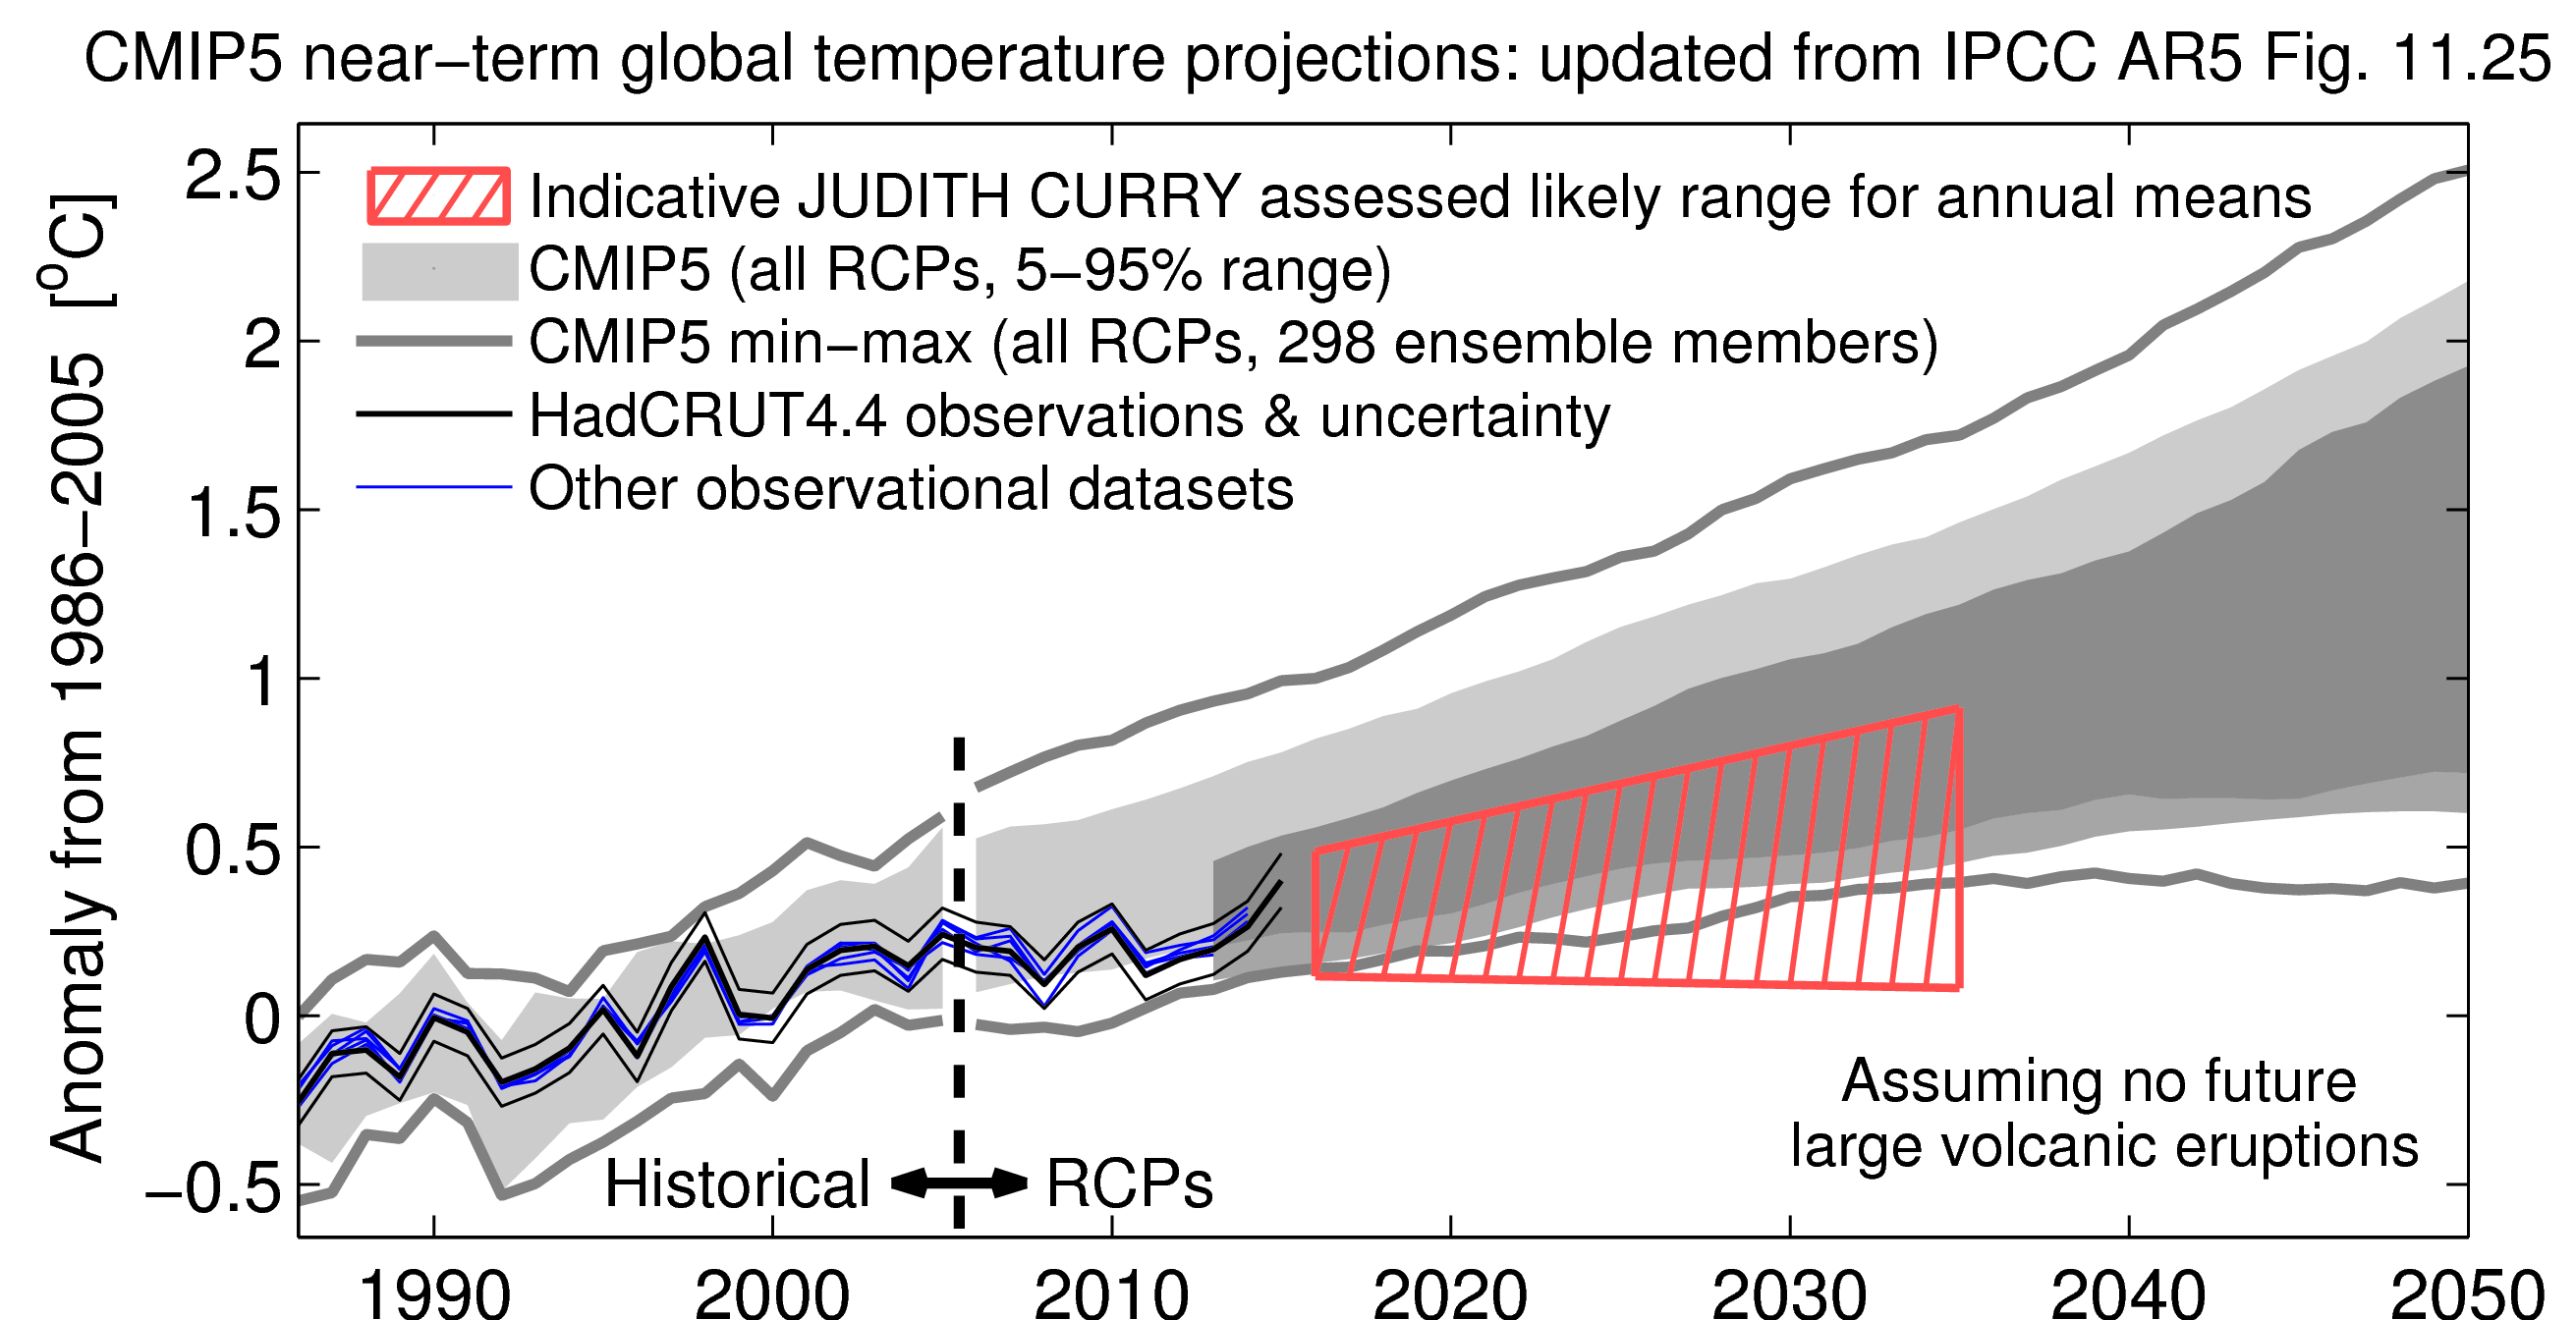
The first figure below shows the IPCC AR5 assessment (published in 2013), with the observed global temperature time-series updated. After a lengthy and useful discussion on twitter, Judith Curry confirmed her belief that the assessment should have been 0.2 – 0.6°C (second figure), which includes the possibility of global cooling inside the likely range (red hatching).
So, two views are now “on the record”. Any others?!
If you are willing to accept that the global temperatures have hardly exceeded that reached during the 1998 El Nino, i.e. that the hiatus happened, then we are seeing a new record being achieved with the current El Nino. This means that global temperature do not increase linearly with CO2 concentration. In fact the temperature is held in a state of negative feedback until a new El Nino happens. The result is not a smooth rise in temperatue but rather a set of steps each occurring at the time of a strong El Nino.
I am suggesting that after this El Nino we will enter a new hiatus, which will last until the next El Nino, or some other tipping point is passed.
This is based on the idea that the climate is a dynamical system consisting of a network of positive and negative feedbacks. At any point in time the net effect will be that either positive or negative feedbacks dominate. When the negative feedbacks dominate then the temperature will remain fairly constant, but qhen the positive feedbacks dominate then the climate will change abruptly until it moves into a state where the negative feedbacks dominate. It will then remain in that stable state. Obviously [?] it will spend more time in the stable states than in the unstable states, hence long hiatuses and short temperature rises.
Temperatures have increased linearly with log(CO2). See this simple plot (Sorry, do not know how to get it in-line).
I’ll go on the record in support of the IPCC assessment. We will certainly have cooler years than this one, but 20 year cooling trend seems unlikely to me at this point (for whatever that is worth). Where would Ed Hawkins place the red hatching?
Hi Layzej,
As it happens, I was in charge of producing the original IPCC AR5 figure, so I agree with that assessment!
Ed.
Ed – does natural variation only work in one direction? Seems like Professor Curry’s kitchen does sushi only.
Emmmm, curried sushi???
Ed/IPCC range 0.3-0.7
JC range 0.2-0.6
The difference is so small it makes you wonder why she needs to be singled out in any way from the herd.
It might appear a small difference, but given that we have already warmed since 1986-2005, it is actually quite a change in the slopes of the forecasts.
Ed.
Nice head-to-head, thanks for publishing it.
Out of curiosity when does the observation data finish and how is it handled. Actually looking closely it looks like annual data and ends 2014. If that’s the case it looks like 2015 is going to send the obs above the upper limit of both those red boxes and only one year to bring it back in line.
The 2015 (so far) data is included for HadCRUT4 (black lines), but not the other datasets yet. Will update all this when the final 2015 numbers are in.
Ed.
:$
Hi Ed,
If you want a qualified guess, I would stick to the CMIP5 model average..
If humankind can follow the rcp 6.0 scenario, a model average with 71% SST and 29% land air temp suggest a rise of 0.6 C between 1986-2005 and 2016-2035.
A 20-year running average of a global observational index should (due to natural variation) not be more than 0.1 C away from the model average , so I come the conclusion that the temperature rise for the period above will be in the interval 0.5-0.7 C.
If humanity instead follow the business-as-usual scenario, rcp 8.5, the interval should be adjusted up by 0.1 to 0.6-0.8 C.
Given this scenario uncertainty (rcp 6.0- 8.5) the full interval of my guess is 0.5-0.8 C
Even if solar does what Professor Curry apparently thinks it’s going to do, your range looks about right to me. I think natural variation is going to shock her: slight tip to El Nino dominance; mostly positive PDO index numbers; gentle rise in the AMO. That means a lot of warming will shock her because her CS number is way too low, and the Maunder would have gone unnamed if ACO2 had been above 400 ppm then.
Hi JCH,
Ignoring solar and volcanoes how is ENSO going to evolve over the next 2 years?
http://www.jamstec.go.jp/e/jamstec_news/20151104/
A big temp spike with the current El Nino then a rapid fall back to La Nina conditions, fig 2(a) compared with 97/98 2(b).
As for the AMO yes there are signs that the Tropical North Atlantic is warming and that cool pool south of Greenland seems to be weakening , nice animation here;
http://www.ospo.noaa.gov/Products/ocean/sst/anomaly/anim_full.html
Conclusion from JAMSTEC
“Global Warming Hiatus appears to have ended in 2014 and we expect a start of a reversed decadal-scale phase which may strengthen the global warming impacts However, the winter from 2016 through 2017 may be an exception during which it does not get so warm”
“Provided by Application Laboratory (APL)/JAMSTEC”.
All in all it will be interesting to see whether we are going to get a step change upwards to a new higher level.
Stephen – since the PDO index has already spiked upwards, I have doubts about 1999 being the right place to look for guidance. If you look at ENSO during time frames where the PDO index is making a ramp upward toward a peak, then GMST can go up even during La Nina events.
My hunch is we’re in a comparable situation to 1978, with lots of El Nino in our immediate future (the big La Nina event that initiated the PDO ramp up 1975 to 1985 were in the past), but I also think there is simply no way to know.
Professor Curry, looking at her blog comments, seems to think the PDO/ blob is not an actual positive phase of the PDO, and she seems to be expecting the PDO to soon resume the persistently negative phase it entered after 2005. If she is right, then La Nina is going to be frequent, and the pause will resume. And, she’s expecting there to be a downturn in the AMO.
Hi Ed: I’d like to use the first figure in an upcoming overview talk on AGW. Is it fair to characterize the observed temperature trend as below the median CMIP5 projection, relative to 1986-2005? If so, is there any explanation as to why other than simply short term variability in the climate system? Finally, is it still credible to say that the lower rate of warming since 1998, if this is indeed the case, suggests TCS/ECS might be on the lower side of the accepted range?
thanks, David
Hi David,
Yes, the trend has been below the median projection. However, those projections did not include any of the recent small volcanic eruptions or downturn in solar activity. They may also have been too optimistic about the reduction in sulphate aerosol pollution. These factors would all mean the projections would be too high. Other factors include decadal ocean variability and not comparing like with like. I am not convinced that TCR is much below the median of the models, although I don’t think it is at the top end either.
cheers,
Ed.
Ed: Linear regression on HADCRUT monthly values from 1975 through Oct 2015 gives 0.175C warming per decade and a 2030 extrapolated warming of 0.62C above a 1986-2005 baseline. This is similar to Olaf’s projection based on CMIP5 posted above. So the IPCC range is probably a little low unless there is some slowdown in the rate of warming experienced over the past 40 years.
Taking a closer look, linear regression predicts a 2016-2035 HADCRUT mean of 0.52 above the 1986-2005 baseline, just slightly above the midpoint of the IPCC range. So the IPCC range is roughly consistent with the warming trend of the past 40 years.
“Linear regression on HADCRUT monthly values from 1975 through Oct 2015 gives 0.175C warming per decade “
Important to realize that 1975 marked the end of the cooling period 1945-1975, so yeah, that year is probably not a representative starting year for trends.
But it does set the high water mark for expected rates of warming – no higher than ~ .17C per decade – since all starting years since 1975 have lower rates of warming.
That stands to reason because pentadal rates of radiative forcing peaked in the 1970s also.
The results are not very sensitive to the start date. Starting in 1985 instead of 1975 drops the warming rate by only 0.012C. Note that a relatively cool period has just ended, so these regression-based warming rates are going increase over the next couple of years.
Here are the backward looking trends through 2014 ( last complete year ).
1.7C/century experienced since the 1970s appears to be the high water mark, consistent with the end of the cooling trend from 1945 through 1975.
That’s also consistent with rates of radiative forcing increase which also peaked in the 1970s.
When I pick cherries, get .194C per decade. And it warmed from 1950 to the mid 1970s (PDO interrupted), when the ramp up of the PDO commenced.
Grant Foster (tamino) predicted a range of temperature anomalies at + – 0.2 °C that would follow, from 2015 to 2040, the same trend as that of 1970-2014.
According to the database that varies from 0164 ° C to 0175 ° C, with an average of 0.170 ° C
See : https://tamino.wordpress.com/2014/12/09/is-earths-temperature-about-to-soar/
Ed: The tone and substance of your climate blog is enjoyable. Refreshing.
Kudos.
Cooling?! By what mechanism? Or does Curry attribute it to mathematical possibilities but not the physically relevant realm? Perhaps she thinks CCS will become feasible mixed with stratospheric aerosol injection? Otherwise, cooling sounds like crazy talk.
Hi John,
I think the “possible” Judith Curry cooling scenario is based on the PDO ,following the current “Godzilla El Nino” flipping back negative and the AMO transitioning to a prolonged negative state starting in the next few years. Should this occur then her position is plausible rather than crazy. Who knows?
There was a flip back after the 1998 Godzilla El Nino with a Godzilla La Nina. I expect the same to happen again as the temperature enters a new period of oscilation with the max. temperture hardly exceeding the new record. I proposed a step function but each step is into a new set of oscillations, just as we have seen over the last 18 years.
Of course that all depends on the Arctic sea ice surviving next summer under the warmer conditions. If it all melts by September, then it will not reform since it needs the ice pack there for the SST to fall below 0 deg. C [C.E.P. Brooks, 1970].
You can see how the sea ice grows out from the central pack here: http://www.abmcdonald.freeserve.co.uk/north.htm The resulting change in albedo the following summer will have severe consequences for climate in the NH.
Hi Stephen,
Thanks for sharing your thoughts. For some reasons when thinking AMO and PDO I was thinking they were decadal, not multidecadal. You’re correct though… I can agree with plausible.
Per Nielsen-Gammon , the pattern so far has been that
Hi RB,
Thanks for the Nielsen-Gammon plots, very interesting though there is another ocean that exhibits warm/cool phases that affect global temperature. The Atlantic ought to be included using the same methodology on the scatter plots?
The role of the AMO is here;
http://static.berkeleyearth.org/pdf/berkeley-earth-decadal-variations.pdf
“We find that the strongest cross-correlation of the decadal fluctuations in land surface temperature is not with ENSO but with the AMO. The AMO index is
plotted in Figure 2.”
Both Ed’s plot and Judith Curry’s from the main article deserve scientific merit and consideration.
I’m not buying it as a cause of changes in the trend direction of the GMST, but we are about to find out as this EL Nino will wind down and something will happen next.
Stephen,
Correlation does not equal causation though. And in this case, if you look at figure 4, you can see that the amo at peak correlation is mostly lagging the global average.
I suspect the main reason why amo shows stronger correlation than other indices in this test is that volcanic eruptions have strong impact on amo and not in the others.
I’m not really sure what Curry expects but I have generally assumed that internal variability (ocean atmospheric connections) will work over the next years to slow energy flow into the high latitude NH. For example I think she expects the Atlantic arctic ice to increase as the Barentz/Kara Sea cools. Think arctic amplification working in reverse to how its manifest over the late 20th century. Whether this will be enough to drive down the global trend I have no idea. I think she also sees some negative natural external amplification as well (maybe).
Observed trends would appear consistent with the box,
but also consistent with low end rates of warming:
http://climatewatcher.webs.com/LukeWarming.png
With the proposal of Tamino (a constant ten-year trend in ~0,17°C from 1970 till 2040), the average global temperatures in the 2016-2035 period is 0.3 – 0.7°C above the 1986-2005 average.
If achieved, this would be a huge information. A constant trend over 70 years has never happened since 1850 …
On the other hand, the likely indicative range of annual averages (area in red in the 11.25 graph) is wider than the 0.3 to 0.7 ° C announced. The average global temperatures in the 2016-2035 period is ~0.21 to ~0.81 ° C above the 1986-2005 average.
The average decadal trend over the period 2016-2035 is here ~0.20 ° C.
Yes, the red hatching shows the ‘likely’ range for annual means consistent with the 20-year average (2016-2035) being 0.3-0.7K above 1986-2005, so is wider to allow for variability from year-to-year. The 0.3-0.7K range is the assessed forecast.
cheers,
Ed.
0.3-0.7K is 0.5K +/- 40%. That is only slightly less vauge than the projections made in the 1970s of 1.5-4.5 C for a doubling of CO2. That was equivalent to 3.0 deg C +/- 50%.
So long as no-one can see that the climate system is non-linear then it is difficult to see how one can take any projections seriously. That includes those from Curry and Tamino.