The slower warming of global temperatures in the early 2000s has motivated many papers examining the modulation of global trends by climate variability. One question that has emerged is: what happens after a pause?
Observed global temperatures showed a 10-year trend of near-zero in the early 2000s, which is likely due to a combination of internal variability and natural forcings (solar & volcanic activity) temporarily offsetting the warming from greenhouse gases. When these temporary cooling influences are removed, what happens to global temperatures?
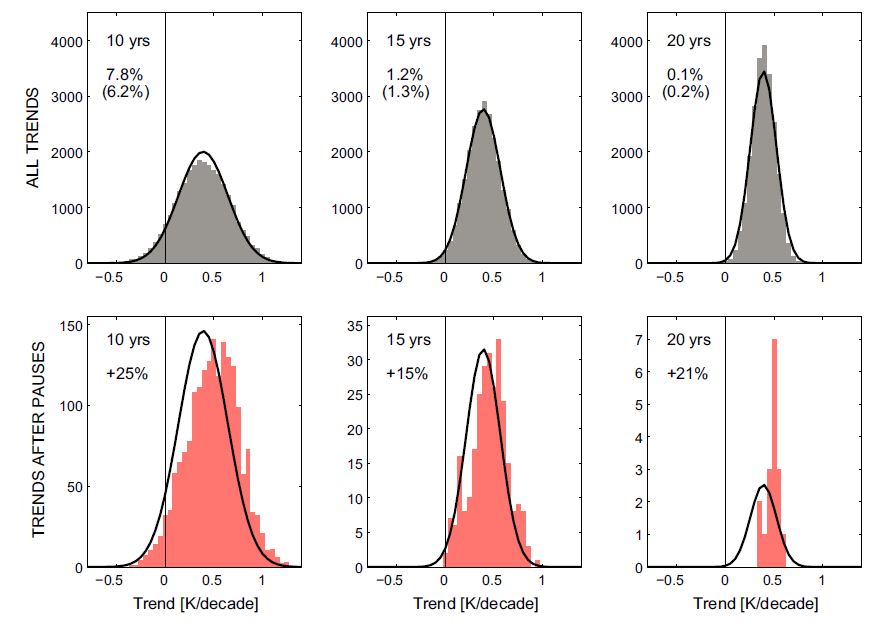
The figure (top row) shows the distribution of all 10, 15 & 20 year trends in a large ensemble (230 members) of simulations with the FAMOUS GCM with CO2 increasing at 1%/year. The mean trend is clearly positive, but there are also many periods of cooling, including several lasting 20+ years. The black curve shows the expected distribution using the control simulation, offset by the mean warming, highlighting that the control simulation alone provides a good estimate of the spread in possible trends.
If we then select all periods of the same length which occur immediately after periods which show a cooling then the distributions are shifted towards larger warming by around 20% (bottom row). In FAMOUS there is an increased likelihood of a faster than expected warming period (or ‘surge’) following a pause and this not just simply due to the removal of the cooling periods from the distributions.
So, will the real world similarly exhibit a ‘surge’?
I think we are at a sort of crossroads. The general talk about the pause is that it is temporary and warming will resume, perhaps at an accelerated rate as claimed in this paper, i.e. a “surge”. There is a presumption as well that if warming has been indeed going into the oceans for the past 15 years then its release might be the mechanism for warming returning with a vengeance.
On the other had, several solar physicists have projected the Sun is entering a prolonged period of very low activity, comparable perhaps to the Dalton or even Maunder minimums. Climate scientists have claimed however that the effect of CO2 forcing will overwhelm reduced solar forcings and the warming will only be slowed by a minuscule amount (IIRC the number is in the range of 0.1C/decade).
If by chance the pause extends for another 10 or 20 years or the surface temperatures begin to drop, what is the expected scientific response?
yea, co2 clogs the heat exhaust of oceanic warming, so some larger than normal back pressure hits are pretty inevitable. It’ll not be interesting which part of the engine, ocean (exhaust manifold) or atmosphere (the pipe), will blow up first. Maybe the exhaust even gets totally blocked (CO2 will saturate like in Venus) and we can kiss our engine (earth) goodbye.
It had occurred to me that you could actually reverse the question and possibly come to an alternative answer. Presumably there are surges where the warming trend exceeds the ‘expected’ trend from forcing. How often are these followed by slowdowns?
If we applied this to the real world then 1970s-1990s could be the surge (overwarming) followed by a correction during the early 21st century hiatus.
Its a question of understanding where the different warming ‘phases’ of the past century fit into the simulation histograms
Hi Ed,
The answer is in the question: ‘Does the climate system have a memory short-term memory’ – perhaps the oceans wouldn’t even ‘feel’ a short-term climate blip less than 30 years if it (which is probably is) super-efficient at distributing heat and the radiation budget re-adjusting itself.
I’m inclined to say that its like a loaded dice. Throw lots of sixes in a gamble, and you don’t play catch up in the second game. I think it’s independent of the past.
Chris