Trends in global mean temperature are not static through time. Changes due to radiative forcings are influenced by internal climate variability. A recent paper by Karl et al. concluded that:
the central estimate for the rate of warming during the first 15 years of the 21st century is at least as great as the last half of the 20th century. These results do not support the notion of a “slowdown” in the increase of global surface temperature.
Are these conclusions, based on comparing a few periods, correct?
The figure below shows rolling 15- and 30-year linear trends in both HadCRUT4.3 (top) and the new Karl et al. (bottom) global temperature estimates, along with trends in radiative forcing (including solar, but without volcanic eruptions).
Karl et al.’s conclusion that the warming during the most recent 15 years compared to the second half of the 20th century (grey dashed line) is broadly correct, although I would suggest that ‘similar to’ is more appropriate than ‘at least as great as’.
But, there has clearly been a slowdown in the rate of warming when compared to other periods, e.g. those centred on the 1990s.
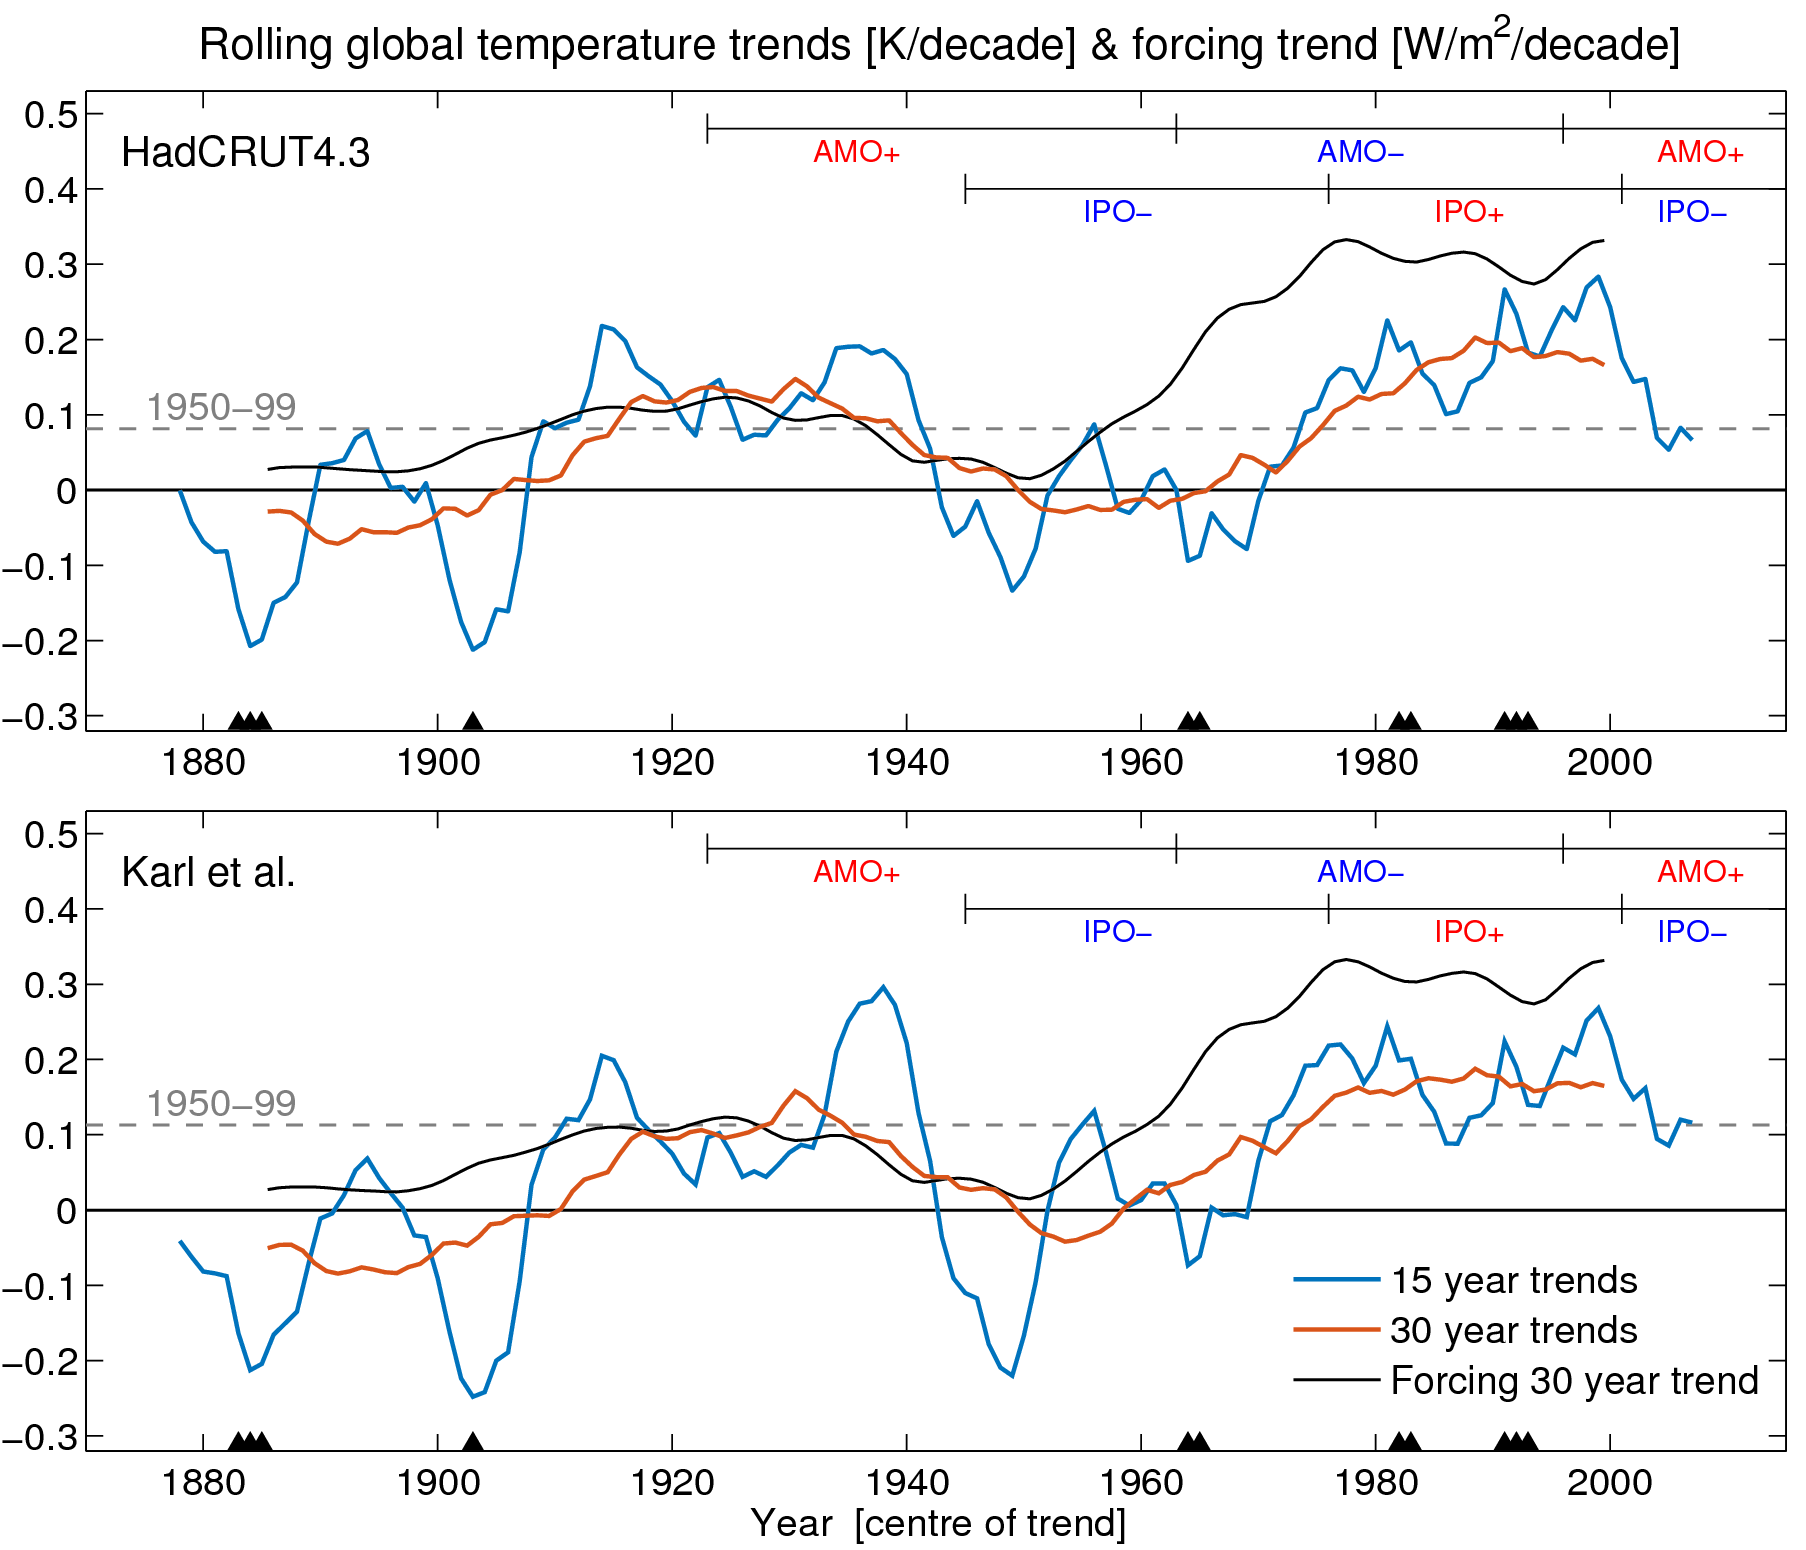
What causes these variations in rate of global temperature change? The response to radiative forcings (black) and volcanic eruptions (black triangles) is superimposed on changes due to modes of climate variability, primarily the Inter-decadal Pacific Oscillation (IPO) but maybe the Atlantic Multi-decadal Oscillation (AMO) as well.
We do not expect changes in temperature to be uniform in space or time. We need to move away from the binary comparison of comparing individual short periods of temperature change and improve our understanding and communication of the whole spectrum of global temperature changes.
The efforts of Karl et al., and the other similar international groups working on improving estimates of global temperatures, are to be applauded. There are still uncertainties in historical global temperature trends, but the big picture of a warming planet due to anthropogenic factors is certainly clear to see.
These anthropogenic changes have always occurred, and will continue to occur, against a background of natural climate variability.
I don’t understand why ‘the big picture of a warming planet due to anthropogenic factors is certainly clear to see.’ The HadCRUT increase since 1880 is only 0.79 C with a trend of 0.64 C per century.
The HadCRUT increase since 1880 is only 0.79 C with a trend of 0.64 C per century.
The warming trend over the last 30 years is 30 times greater than the trend between the last glacial maximum and the current interglacial. The temperature difference between the two periods was about 3.5C. http://davidappell.blogspot.ca/2015/06/current-warming-30-times-faster-than.html
The fact that the 30 year trend is 2.5 times as great as the long term trend since 1880 may suggest that warming is accelerating: http://woodfortrees.org/plot/hadcrut4gl/from:1880/trend/plot/hadcrut4gl/from:1985/trend
Since the AMO cycle lasts 50-70 years (and is now at a peak since about 2000), the PDO lasts 40-60 years (and is now cooling since about 2000) and the Gleissberg solar cycle lasts 60-120 years (and peaked in about 2005), I would suggest that 30 years is too short a period to consider.
Richard – solar changes are included in the radiative forcing curve, and are relatively small compared to the forcing from anthropogenic factors. The IPO/PDO probably does have a noticable effect on global temperatures as the figure shows, which is why it is important to look over longer timescales to average out the influence of variability. So, looking at lots of 30-year trends (as in the figure) shows the longer term anthropogenic warming. It is important to note that we do not expect the trend to be linear, especially as the rate of change of forcing has increased in the past ~60 years.
cheers,
Ed.
No, I don’t expect the trend to be linear either, despite the monotonic increase in CO2. Since 1880 we have had cooling to 1912, warming to 1940, cooling to 1970, and warming to 2014, according to http://www.realclimate.org/index.php/archives/2014/12/recent-global-warming-trends-significant-or-paused-or-what/
As I have mentioned, the natural trends are all pointing downwards over the next few decades, so (for example) Vahrenholt and Luning expect cooling of about 0.3 C until about 2040.
Richard – you can clearly see the shift to positive temperature trends in recent decades, along with the positive radiative forcings, primarily due to anthropogenic activities. Why do you say ‘only’ 0.79C?
cheers,
Ed.
I did reply to this, but I didn’t see it appear. I said only 0.79 C because much has been said about a 2.0 C increase, which at 0.79 C in 134 years would take 339 years from 1880, which takes us to AD 2219.
Richard – in this comment you are assuming the warming has been linear and will be linear into the future. Yet above you say you do not expect it to be linear. Anthropogenic forcing accelerated post-1950s as is clear from the figure above. Extrapolating from 1880 makes no sense in such a situation – the trends are very much non linear.
A paper published this week discusses the possible effect of a grand solar minimum:
http://www.nature.com/ncomms/2015/150623/ncomms8535/full/ncomms8535.html
which has interesting regional consequences, but is a small fraction of the global anthropogenic forcing.
cheers,
Ed.
Hi Ed
I don’t think he is saying linear..
Merely, we’ve had 0.79C in 134 years, especially as he pointed out, shorter term high rates of warming, pausing, within that period.
Karl plays that trick though? starting in 1950, to get a linear trend .. to mask a shorter term high rate of warming, and masking the pausing period from 2000..
KArl et al, wanted to get the headline, warming at 0.16 (whatever the figure was) a decade warming hasn’t stopped , and that there is no ‘pause’.
(thus politics)
(I prefer ‘slowdown’)
Thanks Barry. I prefer slowdown too. That’s why the Real Climate article doesn’t identify it as a change point.
I’m not assuming that warming has been linear and will be linear into the future. I’m assuming that the trend since 1880 (which was already in the industrial era) will be much the same in the future, and will not accelerate dramatically, as the alarmists are assuming.
The Nature abstract says :-
“Here, we explore possible impacts through two experiments designed to bracket uncertainty in ultraviolet irradiance in a scenario in which future solar activity decreases to Maunder Minimum-like conditions by 2050. Both experiments show regional structure in the wintertime response, resembling the North Atlantic Oscillation, with enhanced relative cooling over northern Eurasia and the eastern United States. For a high-end decline in solar ultraviolet irradiance, the impact on winter northern European surface temperatures over the late twenty-first century could be a significant fraction of the difference in climate change between plausible AR5 scenarios of greenhouse gas concentrations.”
So, even disregarding the AMO / PDO, they expect solar cooling over large populated areas in the next decades.
Hi Richard,
Do you not expect that the rate of warming will increase if the rate of GHG emissions increases, which is what has happened? The GHG concentration change has been rather non-linear so using a simple rate of change since 1880 to now to make a future prediction is not credible.
cheers,
Ed.
Ed, the Ineson et al paper you linked to is really picking up interest in the MSM and blogosphere. Might be worth a specific post on this, to place it the “wider” context of solar, oceanic, anthropogenic and stochastic variables ?
http://sciences.blogs.liberation.fr/files/noaa-science-pas-de-hiatus.pdf
Above is a link to the paper for anybody interested.
I have a few question. Firstly , I’m just curious, has this become the ‘official’ timeseries of NOAA? I guess I’m curious whether this timeseries becomes part of future IPCC reports etc. Related to this it seems critics have pointed to the fact that the adjustments made in the Karl paper that have lead to the trend changes are ‘out of line’ with how other have done this in the past. Is there any sense the community is debating this?
Finally critics have betrayed this paper as a technical paper about SST adjustment. In many ways a paper in different, more technical journal where the details of the process could be throughly explored would have made more scientific sense. Jumping to the headline grabbing ‘hiatus busting’ Science paper seems less science/more showbiz!
HR as I understand it the global temps used by NCEP for the data assimilation and initialisation of numerical weather prediction models ie the GFS which MUST be as near to reality as humanly possible are way out of “kilter” with the Karl et al data set.
I’ve access to these through my commercial weather provider, alas they are pay-walled and licensed so I can’t link.
That said you definitely have a point, after all headline grabbing for the MSM seems to be at odds with the requirements of commercial meteorology/supply chain management in this instance.
Hi HR,
Firstly, many of the SST adjustments in the Karl et al paper had already been published in a technical journal about the ERSSTv4 dataset on which their global temperature estimate is based. Secondly, many (but not all) of the SST adjustments introduced in ERSSTv4 were first implemented by the Met Office a couple of years ago in HadSST3. This new global temperature timeseries will now be the NOAA official dataset as far as I am aware.
cheers,
Ed.
Ed,
Here is NOAA on the new operational series.
https://www.ncdc.noaa.gov/sotc/global/2015/5/supplemental/page-1/
As of May, ERSST v4 is operational and part of the new “NOAAGlobalTemp” product (which replaces NOAA MLOST). For now, though, GHCN remains in place. In 2016, improved station coverage from the expanded station data set described in Karl et al 2015 will become operational.
Note also that K2015 produced a series with “polar interpolation” based on conservative linear interpolation. That series showed 0.14C per decade rise over 2000-2014 (see Fig 1). K2015 also stated that kriging would have boosted the rise even more (by about 10-15%). I take K2015 to imply that they are still studying various interpolation methods, but may well implement high-latitude interpolation operationally at a later date.
Since Julia Slingo has also recently stated that the MetOffice is moving in that direction, it is quite likely that fully interpolated GMST will become the norm by the time of the next IPCC report. Better late than never, I suppose.
I agree with you that it is still reasonable to refer to a short-term “slowdown” (i.e. moderate reduction relative to the 30-year trend). But the “hiatus” characterization of GMST (e.g. IPCC AR5) was always a stretch, and increasingly it appears to be untenable. There is simply no compelling evidence of a very severe reduction, much less a “pause”, in the decadal GMST trend.
Hi DC,
That is a good point that the interpolated dataset shows a slightly larger recent trend than 1950-99. K2015 played down this aspect of their study a bit in the text.
Interpolation is obviously an interesting avenue to explore (especially over the Arctic and Africa), but I don’t see how interpolation will fix the sparseness of observations in the southern hemisphere or Pacific, especially pre-1900. Over the satellite period, I can see fully interpolated being justifiable.
When comparing models and observations of GMST we should do so as fairly as possible, e.g. by masking the models etc. But, more to come on this point soon!
cheers,
Ed.
30 years – .16C per decade
40 years – .17C per decade
50 years – .16C per decade
60 years – .14C per decade
70 years – .12C per decade
80 years – .10C per decade
90 years – .09C per decade
100 years – .09C per decade
What does an acceleration look like, and what does a slowdown look like?
In how many decadal slowdowns is the warming rate over the last 5 years of the slowdown period .04C per year?
“I recently turned 60. Practically a third of my life is over.” Quote Woody Allen(1996).
On that basis I’m really looking forward to the next 120 years, give or take, of observational metrics validating the “acceleration”.
Karl et al:
“[T]he central estimate for the rate of warming during the first 15 years of the 21st century is at least as great as the last half of the 20th century. ” [Emphasis added]
This is indeed a correct summary of the results in Fig 1. The “central estimate” trend of the new series with polar interpolation over 2000-2014 is 0.14C per decade as opposed to 0.11C over 1950-1999. As I previously mentioned, Karl et al state that difference would have been even greater if kriging had been employed, instead of a more conservative linear interpolation. Without interpolation, yes, the trend slopes are virtually identical. But taken together, the results have been summarized in a perfectly straightforward manner.
I cannot reply to the latest comment by Ed Hawkins for some reason, so I will reply here instead.
I thought that the increase in CO2 was fairly linear, at least since the beginning of the Mauna Loa record.
The change in global temperature has been very much non-linear :-
http://www.realclimate.org/index.php/archives/2014/12/recent-global-warming-trends-significant-or-paused-or-what/ uses change point analysis to identify the following warming and cooling periods in GISS since 1880 :-
1880-1912 cooling 32 years -0.72 C per century (average of NCDC, GISS and HadCRUT4)
1912-1940 warming 28 years +1.29 C per century.
1940-1970 cooling 30 years -0.16 C per century.
1970-2014 warming 44 years +1.61 C per century.
Hi Richard,
Atmospheric CO2 concentration has been quite non-linear – you can look at all the different contributors to historical and future forcing on this interactive webpage here (it’s not just CO2 obviously):
http://tntcat.iiasa.ac.at/RcpDb/dsd?Action=htmlpage&page=compare
Or this image shows it nicely for CO2 and other GHGs:
http://www.esrl.noaa.gov/gmd/aggi/aggi.fig5.png
cheers,
Ed.
Thanks Ed. Where does the ESRL graph get its data from 1700 from ?
The GHG data comes from various ice cores before direct measurements at Mauna Loa.
cheers,
Ed.
Thanks, can you recommend a good data set that I can correlate with the temperature records ? The sceptics often make the claim that the CO2 / greenhouse gases go up all the time while the temperature fluctuates on decadal time scales.