Back in October 2013, Nature published an analysis by Camilo Mora et al. which discussed when ‘unprecedented climates’ would emerge, with a focus on regions of high biodiversity.
The paper was highlighted by Nature with an associated News & Views article and received widespread media attention (e.g. Climate Central, National Geographic, Guardian, Grist, amongst many). The paper was also in the top 100 most discussed papers from 2013 according to Altmetric.
Unfortunately, it has since emerged that the analysis has some serious flaws. A ‘Brief Communication Arising’ (or Comment) has now been published by Hawkins et al. in Nature (freely available for one month), written by a large group which includes several IPCC Lead Authors, from both WG1 and WG2. There is also a ‘Reply’ from Mora et al., and a new News & Views (N&V) piece by Scott Power discussing the continuing disagreement between the author teams. This is the first ever N&V on a Comment in Nature.
This post provides a slightly less technical description of the issues with Mora et al.’s analysis. The errors in Mora et al.’s Reply are summarised in a separate post. The Carbon Brief blog has also produced some videos on the topic.
Background
The main idea of Mora et al. was to examine when the signal of climate change in regions of high biodiversity emerges from the background noise of climate variability. This is clearly a topic of interest and worth considering. The results were even presented with precise dates for when temperature emergence will occur for individual cities.
The primary conclusion was that the earliest impacts of climate change will appear in the tropics (where key regions of biodiversity exist). This is a robust and correct conclusion, but not new – in fact, the IPCC AR5 WG1 included a whole section on the topic. And, temperatures have already emerged from the variability in large regions.
However, there are many different ways of measuring climate ’emergence’ (or ‘departure’). Mora et al. unfortunately ignored much of the previous literature discussing the various approaches and their methodological choice performs poorly, particularly because it is sensitive to extreme years in the simulated climate. In addition, the analysis grossly underestimates the uncertainty everywhere.
The details
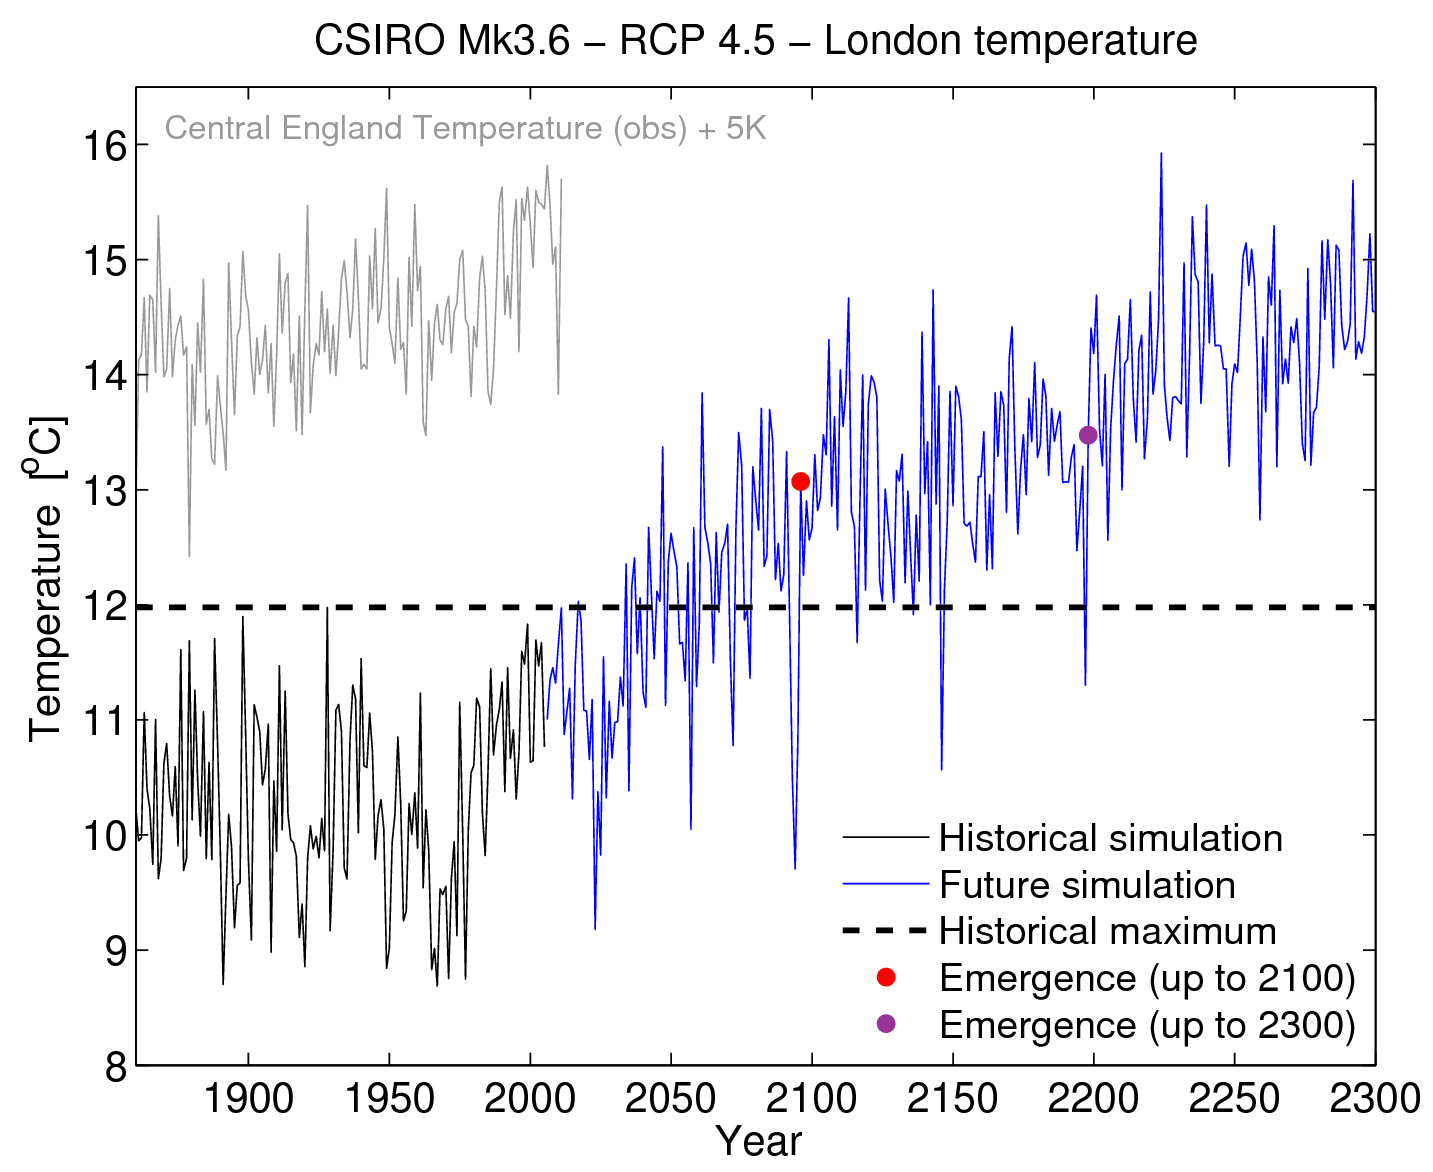
Mora et al. define an ‘unprecedented emergence’ metric by examining climate simulations to find the year for which all subsequent years exceed the maximum temperature in the historical period (defined as 1861-2005) – i.e. even the coldest year after this date is warmer than the warmest ever year before 2005.
An example is shown for London in Figure 1 below for a single simulation. The black line is the simulated historical temperatures, with the historical maximum shown with the dashed black line. The blue line shows the future simulated temperatures which increase until they are always above the dashed black line. At this point, ‘unprecedented emergence’ has occurred.
However, this chosen metric is very sensitive to extreme years. In Figure 1, the warmest historical year in this simulation is around 1930 for London, and many future years are above this during the 21st century. But not all years, e.g. a couple of years around 2095 are unusually cold because of climate variability. It should be obvious that a different simulation with the same GCM would have a different timing of extreme cold years that happen by chance, and therefore have a different emergence year by this definition (also see later). Mora et al. do not account for this uncertainty due to internal variability appropriately.
Note also that Mora et al. only considered simulations which ended in the year 2100 to maximise the number of simulations available. In this London example, Mora et al. would define the emergence year as 2096. But, one-third of the GCMs considered by Mora et al. continued their simulations to the year 2300.
These extended simulations allow a sensitivity test to be performed. If we consider post-2100 data, this simulation has another unusually cold year in 2197, which means emergence doesn’t actually occur until 2198 by Mora et al.’s chosen definition. The fact that single extreme years can make such a large difference to the results demonstrate that this metric, although perhaps appealing, is a poor choice for defining emergence. There are other locations where apparent emergence years as early as 2050 are not robust in the longer simulations.
Note: Mora et al. did not use any historical observations as some reports suggested and also consider other variables, but temperature is their primary metric.
Even more details
This sensitivity to extreme years is not the only issue. Mora et al. made (at least) four crucial errors:
1) Simulation end dates: By only considering simulations up to the year 2100, Mora et al. ignore the fact that later years are likely be within the historical range for some regions, so causing the estimated emergence years to be too early (see Figures 1 & 2). In addition, our Comment shows that this issue can affect apparent emergence years as early as 2050 in each model simulation which continues to 2300.
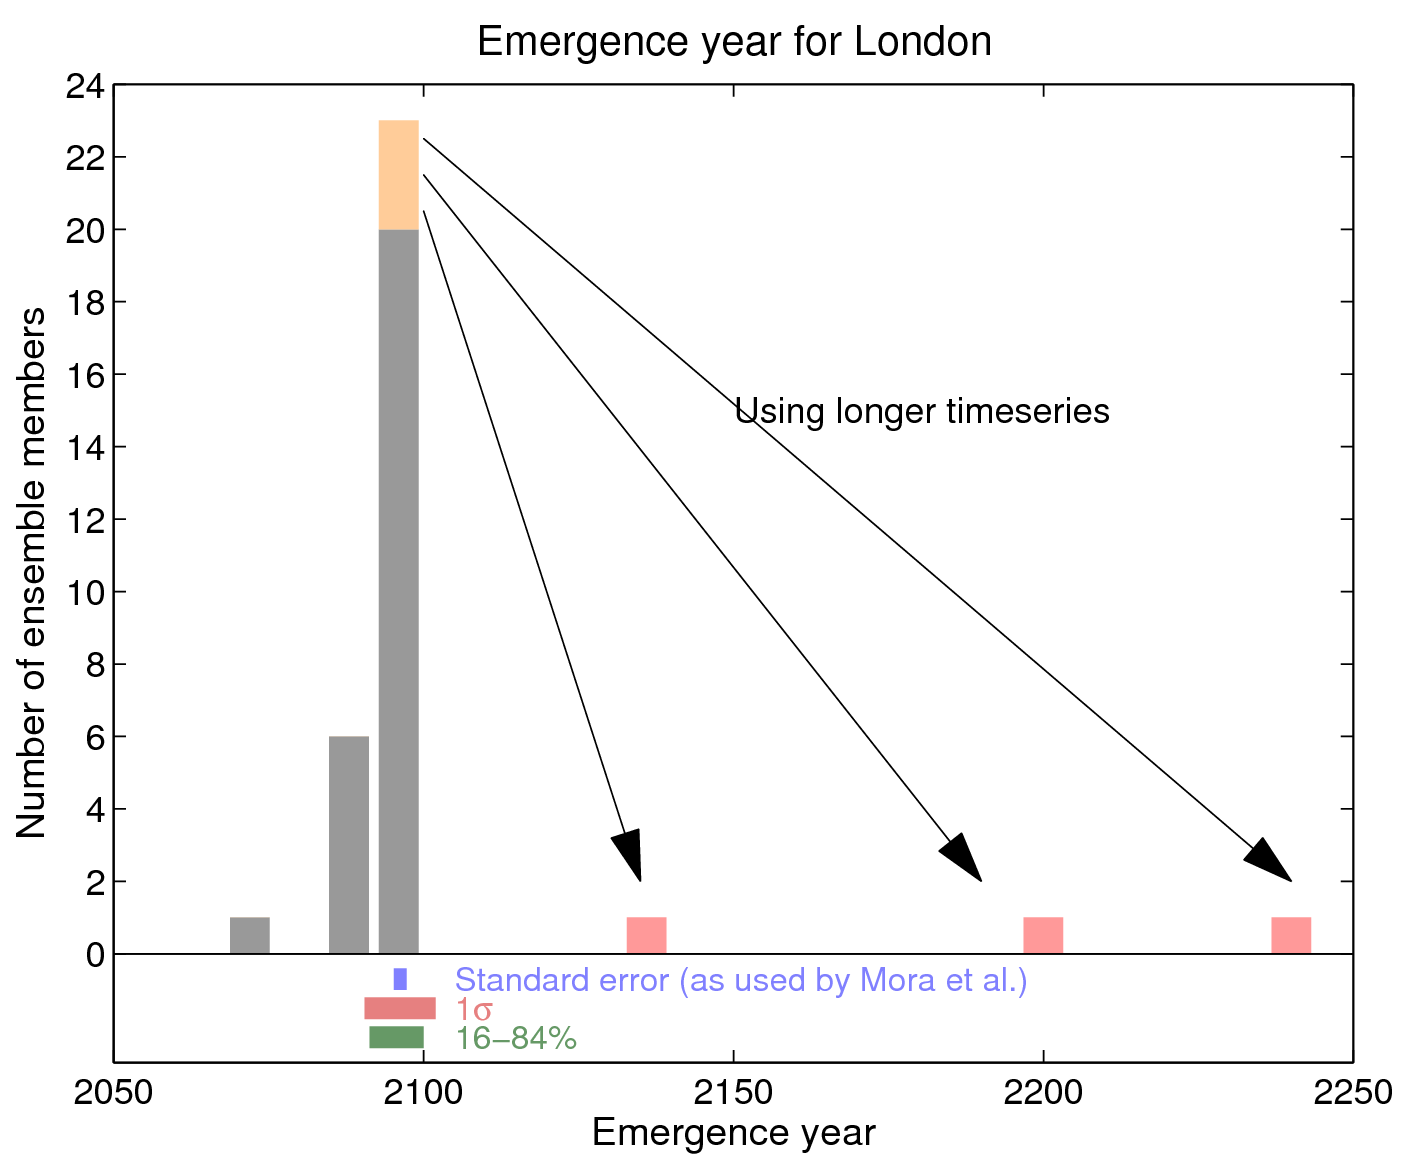
For the London example in Figure 1, the unprecedented emergence is actually 100 years later than defined by Mora et al. (& it could of course be even later still if the simulation was continued beyond 2300). Figure 2 shows that a similar effect is seen in all 3 of the simulations with the same GCM which were extended past 2100. In statistical parlance, Mora’s data was ‘right-censored’, but this was not dealt with appropriately.
2) Artificial emergence: If no emergence is seen in the simulations (i.e. the year 2100 is within the historical range) then Mora et al. artifically assume that the emergence year is exactly the year 2100. For precipitation, which has larger variability and so rarely emerges by Mora et al.’s definition, this results in an emergence year of exactly 2100 almost everywhere, with zero uncertainty, which is clearly implausible and simply wrong.
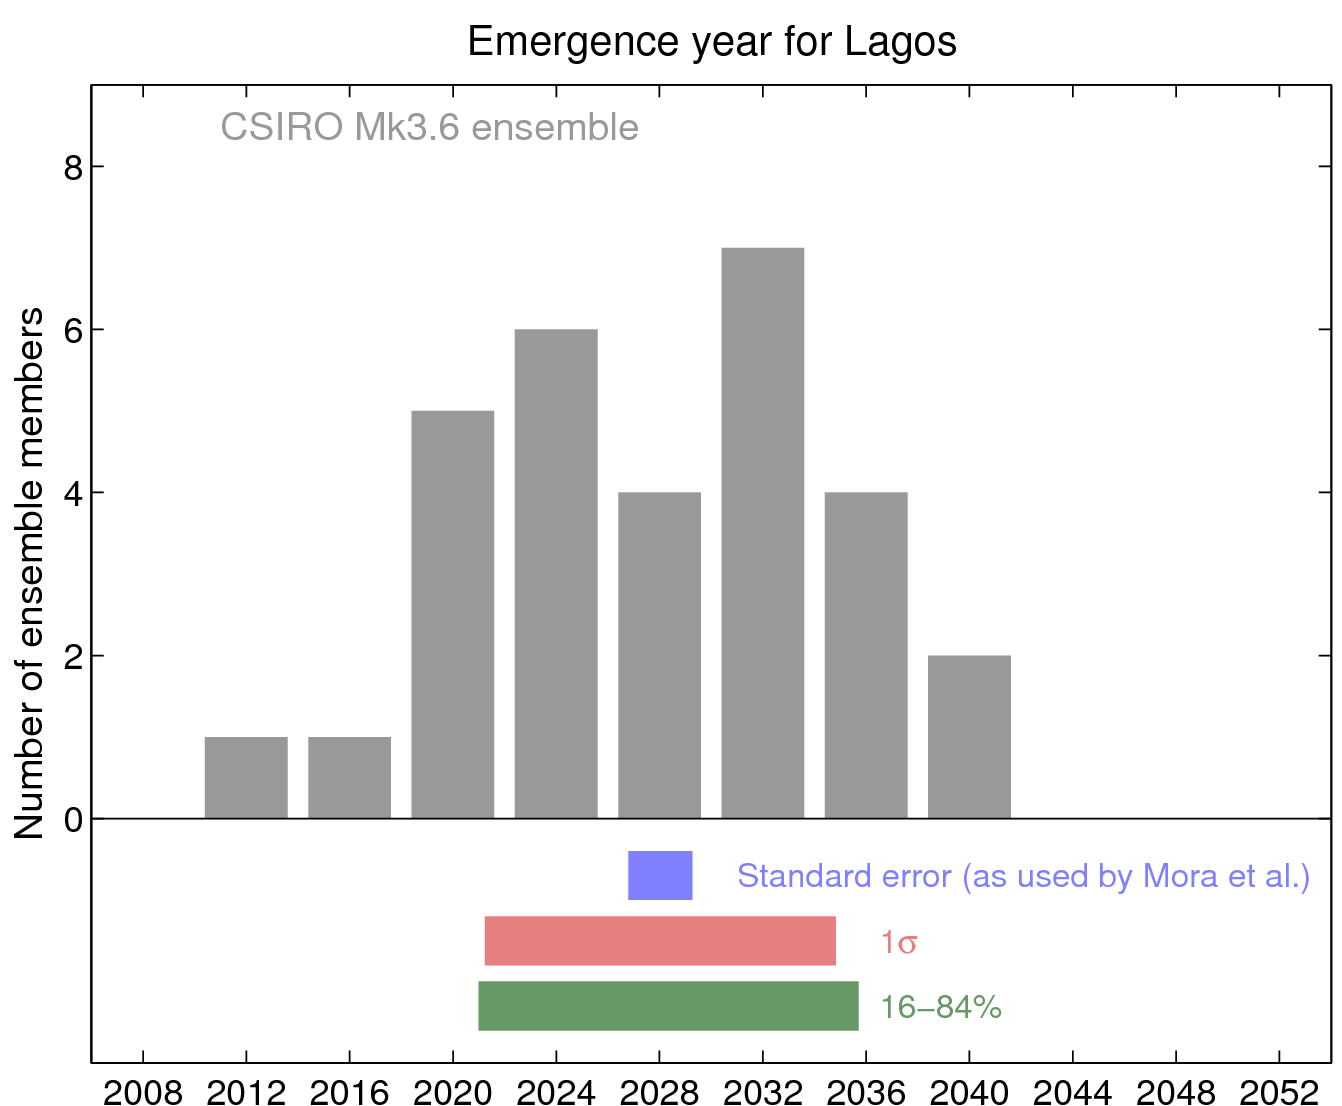
3) Uncertainty quantification: Mora et al. perform their analysis on various GCM simulations from CMIP5 and express their uncertainty estimates using the standard error (SE) of the mean (σ/√N), where N(=39) is the number of simulations used and σ is their standard deviation. The SE is correct for the uncertainty in the value of the mean itself. However, the future evolution of climate will not behave like the mean of this large ensemble, but as a single realization from a range of outcomes. For N=39, and assuming a Normal distribution, there is greater than 85% chance that the actual emergence time at any location would fall outside their quoted standard errors. Also, if they had an infinite ensemble then their uncertainty would be zero years, again clearly implausible. Figures 2 & 3 show distributions of emergence years for a large ensemble from a single GCM (for the cities of London & Lagos) and demonstrate that the standard error (blue) does not represent the uncertainty appropriately.
4) Normal statistics: Mora et al. assume Normal statistics to estimate the uncertainties, but the distribution of emergence years is profoundly non-Normal in many places, partly because of the artificial assignment of emergence to 2100 as described above. This error also produces inappropriate uncertainty ranges.
Previous literature
In addition to these errors, there are many previous studies examining the issues of ’emergence’ of the climate signal which Mora et al. (along with the reviewers & Editors) overlooked. Indeed, the main result of Mora et al. – that the tropical regions are first to experience the effects of a change in climate – is so widely appreciated that it is in the IPCC AR5 Summary for Policymakers:
Relative to natural internal variability, near-term increases in seasonal mean and annual mean temperatures are expected to be larger in the tropics and subtropics than in mid-latitudes (high confidence)
and has it’s own section in the report. Also, the particular ‘unprecedented emergence’ metric used by Mora et al. has been used before by Diffenbaugh & Scherer, who noted and discussed the issues with the ‘end of the century’ effect described above.
Summary and implications
Overall, Mora et al.’s main conclusion of early tropical emergence is correct, but the quoted emergence years are too precise everywhere, and too early in some places. Some further comments:
- The emergence metric chosen by Mora et al. is actually rather conservative – if a simple signal-to-noise ratio is used then earlier emergence times are obtained.
- The overconfidence and errors in the analysis would have been avoided if the previous extensive literature on this topic had not been overlooked. The role of variability in how our climate evolves should not be underestimated, especially on small spatial scales.
- This shows the scientific process working as it should. Mora et al. have offered a potentially useful analysis, but an error has been discussed, the science moves on, and we learn a little more.
Full reference: Hawkins, Anderson, Diffenbaugh, Mahlstein, Betts, Hegerl, Joshi, Knutti, McNeall, Solomon, Sutton, Syktus & Vecchi, ‘Uncertainties in the timing of unprecedented climates’, Brief Communication Arising in Nature, 2014, doi: 10.1038/nature13523
Thanks to all the co-authors on the Comment, especially Bruce Anderson, Noah Diffenbaugh & Irina Mahlstein. This post was discussed with Doug McNeall.
Hawkins, E., Anderson, B., Diffenbaugh, N., Mahlstein, I., Betts, R., Hegerl, G., Joshi, M., Knutti, R., McNeall, D., Solomon, S., Sutton, R., Syktus, J., & Vecchi, G. (2014). Uncertainties in the timing of unprecedented climates Nature, 511 (7507) DOI: 10.1038/nature13523
Mora, C., Frazier, A., Longman, R., Dacks, R., Walton, M., Tong, E., Sanchez, J., Kaiser, L., Stender, Y., Anderson, J., Ambrosino, C., Fernandez-Silva, I., Giuseffi, L., & Giambelluca, T. (2013). The projected timing of climate departure from recent variability Nature, 502 (7470), 183-187 DOI: 10.1038/nature12540
The Reply by Mora et al. is unfortunately behind a paywall, and I can’t get to my University library to read it for a couple of weeks. Can you please briefly describe their defense? [Unless your promised post rebutting their Reply is imminent, in which case I’ll wait for that.]
Harold – check email! 😉
Post on Mora et al.’s Reply coming tomorrow.
cheers,
Ed.
Ed,
Much obliged. Will read and digest, in time for the next post.
Excellent work breaking it down!
Hi Ed,
The claim for their statistic is:
“… we used the first year after which all values would continuously exceed the bounds of historical climate variability.”
from “would continously” I infer “forever”.
In a simpler world I could just cry “foul” and demand they show that the implied distribution from which a sample has been drawn necessarily exists, and has a mean and a variance, leaving it up to them to show that it does.
Why should I doubt such things? Well forever is a very long time.
For a particular emergence to plausibly be the last, there must be a non-zero probability of it being the last.
That is if P(t) is the probability of year t dipping below their threshold, then the infinite product of all the future terms (1-P(t)) must be greater than zero. This can only occur in certain circumstances.
They need to demonstrate at least the plausibility of the underlying distribution existing e.g. having non-zero values.
I am sure that, if correct, none of the above is news,
Thanks Alex. You are right – Mora acknowledges this now and says that unprecedented forever means until 2100. But doesn’t acknowledge that the standard error is an inappropriate measure of uncertainty.
Cheers,
Ed.