The recent IPCC AR5 includes a discussion on the sources of uncertainty in climate projections (Fig. 11.8, section 11.3.1.1), which updates previous analyses using CMIP3 (temperature, precipitation) to the latest CMIP5 simulations. The dominant source of uncertainty depends on lead time, variable and spatial scale.
There are three main sources of uncertainty in projections of climate: that due to future emissions (scenario uncertainty, green), due to internal climate variability (orange), and due to inter-model differences (blue). Internal variability is roughly constant through time, and the other uncertainties grow with time, but at different rates. Although there is no perfect way to cleanly separate these uncertainties, different methods have given similar results.
Overall, the conclusions from CMIP5 are not much changed from CMIP3. For global temperature, the spread between RCP scenarios is the dominant source of uncertainty at the end of the century, but internal variability and inter-model uncertainty are more important for the near-term. For the next decade or so, internal variability is the dominant source of uncertainty. A small caveat to this is the role of anthropogenic aerosols, which are assumed to decline quite rapidly in all RCPs in the next 20 years, and so this scenario uncertainty may be smaller than it should be.
For global temperature, the figures below show two different representations of this information, either as a ‘plume’ (Fig. 1) or as a fraction of the total variance (Fig. 2).
For other variables and on regional spatial scales, the picture can be very different. For example, for European winter temperatures, the internal variability component is more important (Fig. 2). And, for European winter precipitation, scenario uncertainty is almost irrelevant because the internal variability and inter-model differences are relatively much larger (Fig. 3). In fact, for precipitation in all regions, the RCP scenario uncertainty is relatively small when compared to the other sources of uncertainty.
The key messages are that resolving inter-model differences could reduce uncertainty significantly, but there is still a large irreducible uncertainty due to climate variability in the near-term and, particularly for temperature, future emissions scenarios in the long-term.
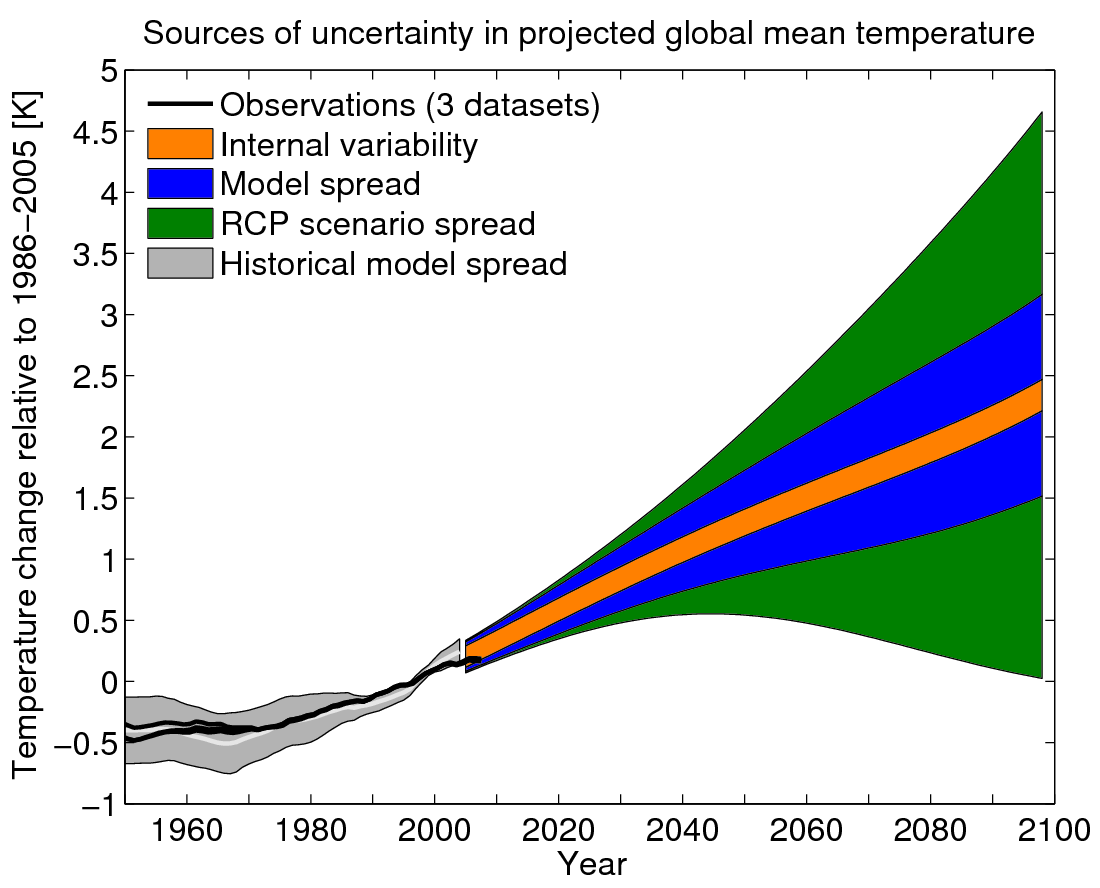
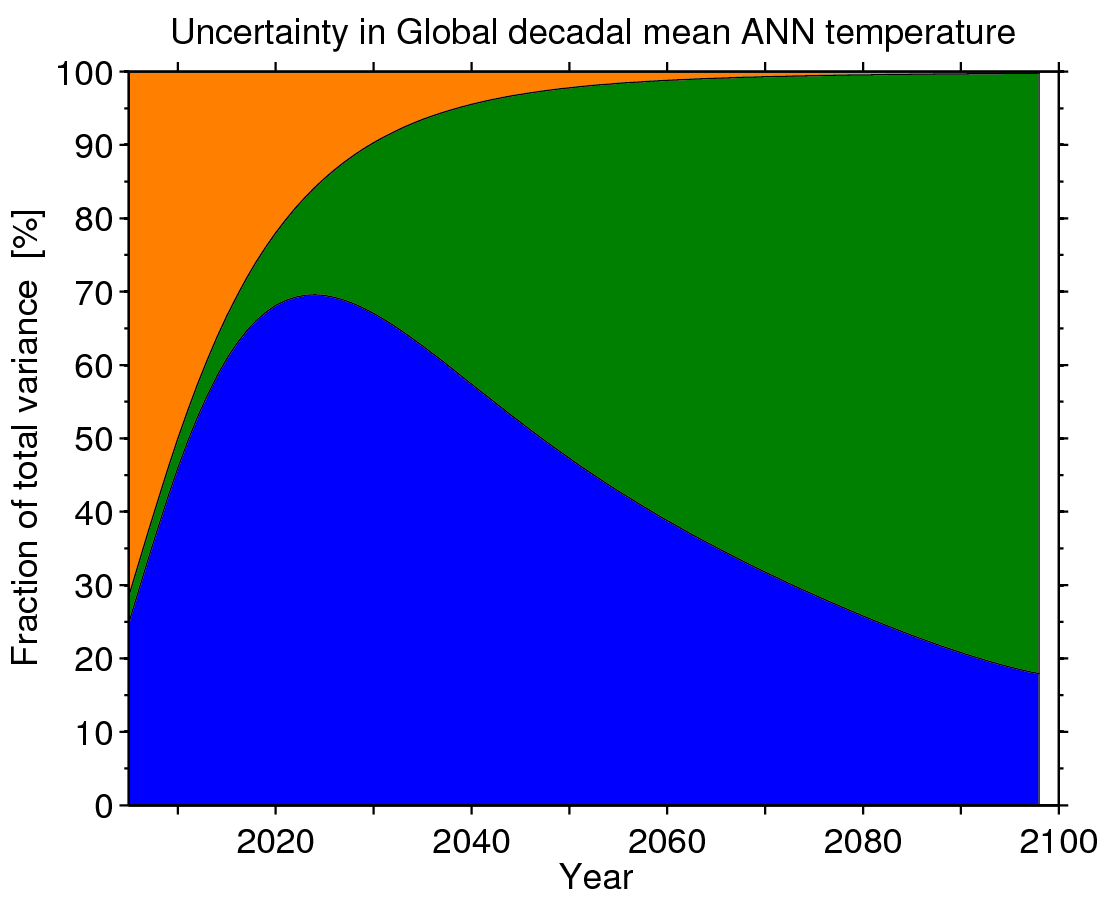
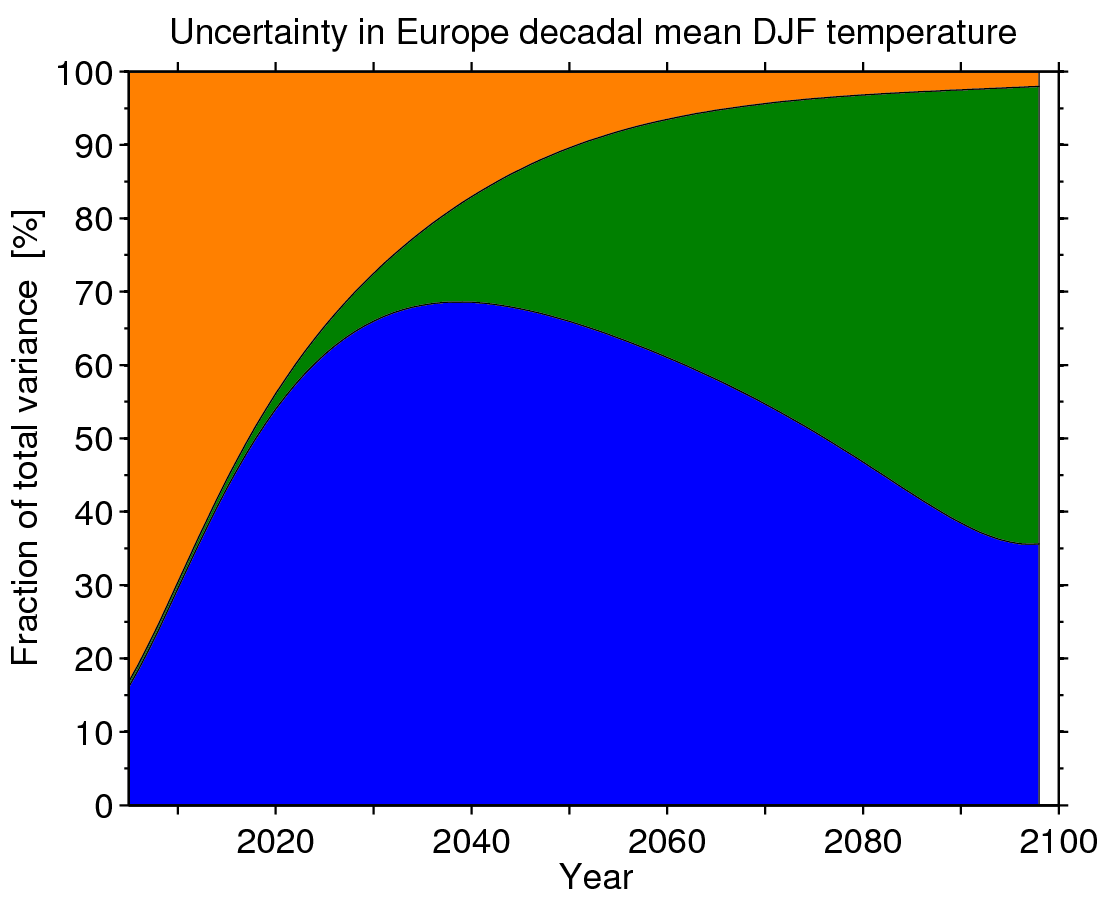
Figure 2: Sources of uncertainty in global decadal (top) and European decadal DJF (bottom) temperature projections, expressed as a fraction of the total variance.
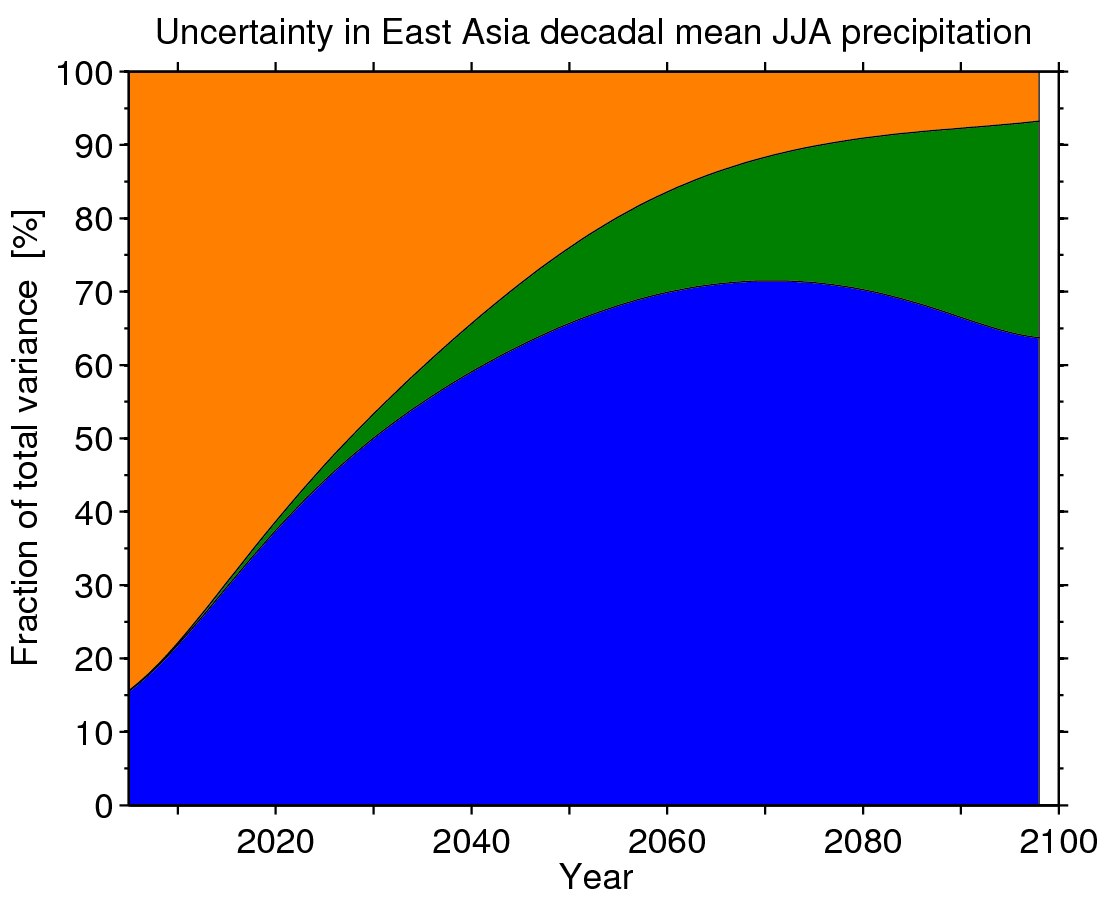
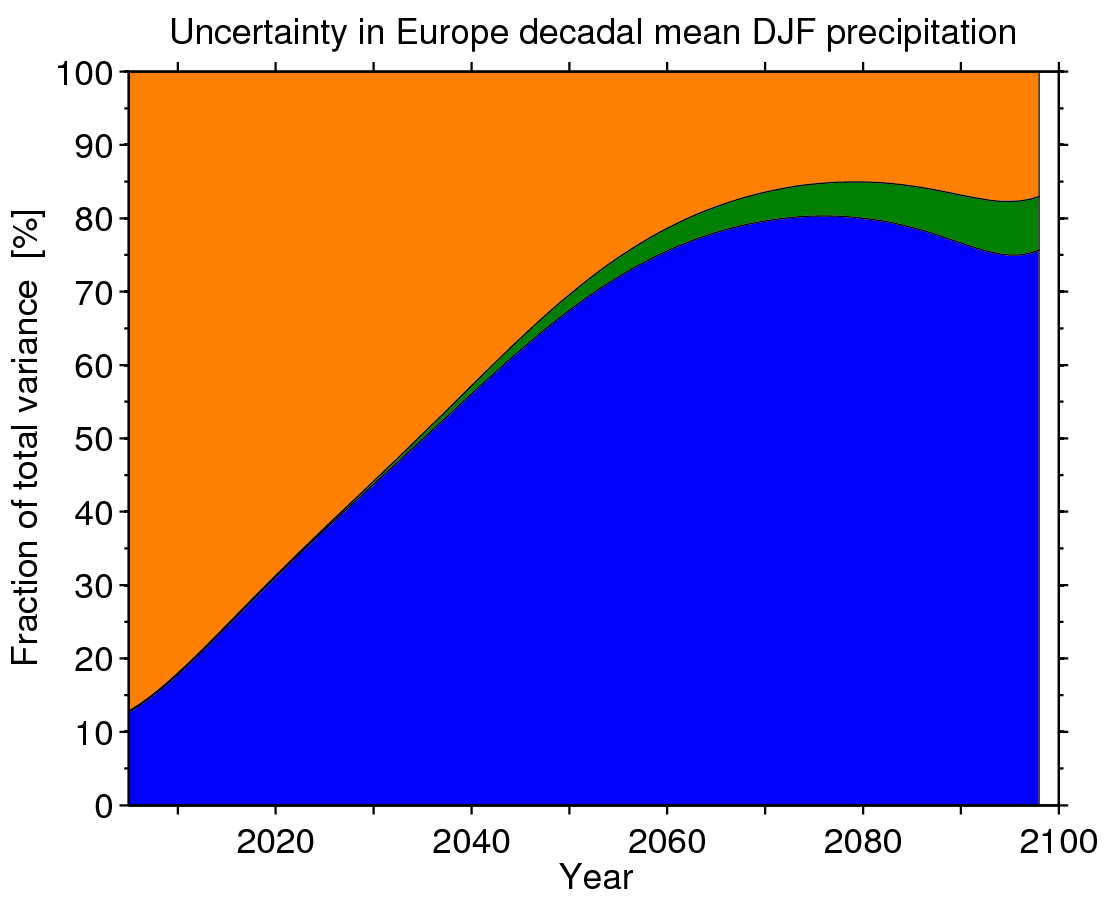
Figure 3: Sources of uncertainty in East Asia decadal JJA (top) and European decadal DJF (bottom) precipitation projections, expressed as a fraction of the total variance.
Figure 1: Are those supposed to be 1σ spreads? 2σ? ±90% etc?
Good point – they are 90% confidence intervals. Will edit post.
Ed.
Thanks Ed!
Quick question: In Fig 1, why is there a discrepancy in 2005/06 between historical and projected spreads (the latter being larger and slightly “shifted” downward)? This discontinuity contrasts with annual averages plotted in Fig 11.9a (i.e. top panel in your recent post on near-term projections http://www.climate-lab-book.ac.uk/2013/near-term-ar5/).
Cheers, Julien.
Ed,
1. Does anyone ever re-run their climate models when the accuracy of data sets is questioned? Or eliminate data from inaccurate monitoring stations and re-run the model?
New study shows half of the global warming in the USA is artificial
Compliant thermometers say +0.155C/decade
Non-compliant thermometer say +0.248C/decade (60% ERROR)
NOAA final adjusted data says +0.309C/decade (99.35% ERROR)
http://www.wattsupwiththat.com/2012/07/29/press-release-2/
2. Please clarify the difference between “margin of error” and “confidence intervals.”
I never see “margin of error” stated in papers, nor the IPCC AR5 report. I can say with 90% confidence that the 2014 hurricane season will have between 0 and 100 hurricanes. Absolutely no value in that 90% confidence, but sure looks like a huge margin of error in the prediction.
Regards,
Joe
Ed what is the width of the internal variability band in figure 1?
By eye it looks to be about 0.25K. If it’s that number and we relate that to observations does it mean that at any one time the temperature can ‘wander’ upto 0.125k above or below the temperature ‘prescribed’ by nett external forcing? (caveat there is some uncertainty when it comes to forcings)
A follow on question is that these uncertainties are calculated using annual data, is that right? If you repeated the exercise with decadal or more (say 17 years) then would the internal variability uncertainty reduce or increase? Presumably if your a person that believes much of the internal variability is produced annually by ENSO then for longer periods this uncertainty would reduce as within a ten (or 17) year period any wandering by a strong El Nino or La Nina would be ‘smoothed’ by neutral and opposite years. If you believe in multidecadal ‘oscillation’ then presumably wanderings within a decadal period would tend to be in the same direction and have …….. i don’t know what effect …… on internal variability uncertainty.
Thanks HR,
Yes – the orange band represents how much the temperatures could ‘wander’ if we knew the scenario and model response perfectly. These graphs are for running decadal means – so for annual data the orange band would be much larger.
There are some visual examples of the role of variability here and here, especially on regional scales.
cheers,
Ed.
Hi
Thanks for a nice post. You state that “The key messages are that resolving inter-model differences could reduce uncertainty significantly”. There are already articles suggesting the lack of spread among climate models is a problem. My opinion is that for processes which are uncertain, diversity is needed to reflect the true confidence intervals of the projections. If you mean resolving inter-model differences through reducing the uncertainties of the physical and chemical processes represented in the climate models, I agree.
Thanks Torleif – I agree – we need to keep model diversity until we reduce uncertainties in the relevant underlying physical and chemical processes.
Ed.
Ed you have mentioned in the past that the very hottest models may be inconsistent with observation. I think you’re an author on a paper (Stott et al??) that argues this very point.
Can you see no argument for dropping the hottest models from the ensemble?
I just noticed your masthead is based on the same type of ‘plume’ graph as Fig1 here. I notice the thick black obs lines are in quite different places relative to the gray historical model spread. So out of curiosity what causes the big difference?
Dear Ed,
The following educational video has been strongly influenced by your work on the sources of uncertainty in CMIP5 projections. I hope you (and the visitors of this blog) will like it.
http://vimeo.com/85531490
Thanks Samuel – very nice!
Ed.
thanks for nice information . but how do we know weather the source is from , internal variably, future emission and model structure?
Hi Ababo,
Hawkins & Sutton (2009) describe one approach to do this: http://journals.ametsoc.org/doi/abs/10.1175/2009BAMS2607.1
Thanks,
Ed.
Hi Ed, thanks for such a nice post and a wonderful, appealing research on uncertainties in climate projections.
I’m very interested in figure 1.
Based on the thoughts and discussions shared above, I am wondering whether it is true to interpret this way:
first, the orange band represents how much the temperatures could ‘wander’ if the scenario and model response can be specified; second, the combination of orange and blue bands shows how much the temperatures could ‘wander’, as the internal climate variability can be considered constant over time and if the scenario is specified; and thirdly, the combination of three bands gives the spread of how much the temperatures could ‘wander’ due to the whole uncertainty.
Another question is that, if it is true to interpret figure 1 the way mentioned above, how could we put this analysis into practice use? I have kept trying to figure out the answer but I haven’t gained much progress.
Could you please give me any help for comprehension?
Hi Mika – yes, that is the correct interpretation. The main purpose is understanding the relative importance of the different sources for different regions, times and climate variables. For example, for the next ~20 years the scenario doesn’t really matter so we can focus on understanding the uncertainty due to models and variations but for the end of the century it is the emission choices which matter most. Thanks, Ed.
Thank you so much !