The Science Media Centre recently held a briefing for journalists on the recent slowdown in global surface temperature rise, and published an accompanying briefing note. The Met Office also released three reports on the topic.
The key points were: (1) recent changes need to be put in longer term context & other climate indicators such as sea level, Arctic sea ice, snow cover, glacier melt etc are also important; (2) the explanation for recent slowdown is partly additional ocean heat uptake & partly negative trends in natural radiative forcing (due to solar changes and small volcanic eruptions) which slightly counteract the positive forcing from GHGs; (3) the quantification of the relative magnitude of these causes is still work in progress; (4) climate models simulate similar pauses.
Media response
There were several articles in the media following the briefing, including BBC, The Telegraph, The Independent, amongst others. One theme in the articles was that the possible existence of such pauses were a surprise to journalists, but not to the scientists. As the observations of global temperature have always shown such variability it should not have been too surprising, but perhaps this message was not expressed or communicated clearly to the media before? Or perhaps it just was not as interesting to the media before?
Early discussions on role of variability
Previous IPCC reports have certainly highlighted the role of variability – for example:
- FAR 1990: Simulated decadal variability was present in some of the first climate simulations (Figure 6.2). Also discussed in the Executive Summary of the SPM.
- TAR 2001: Section 9.2.2.1 – Signal versus noise, including Figures 9.2 and 9.3
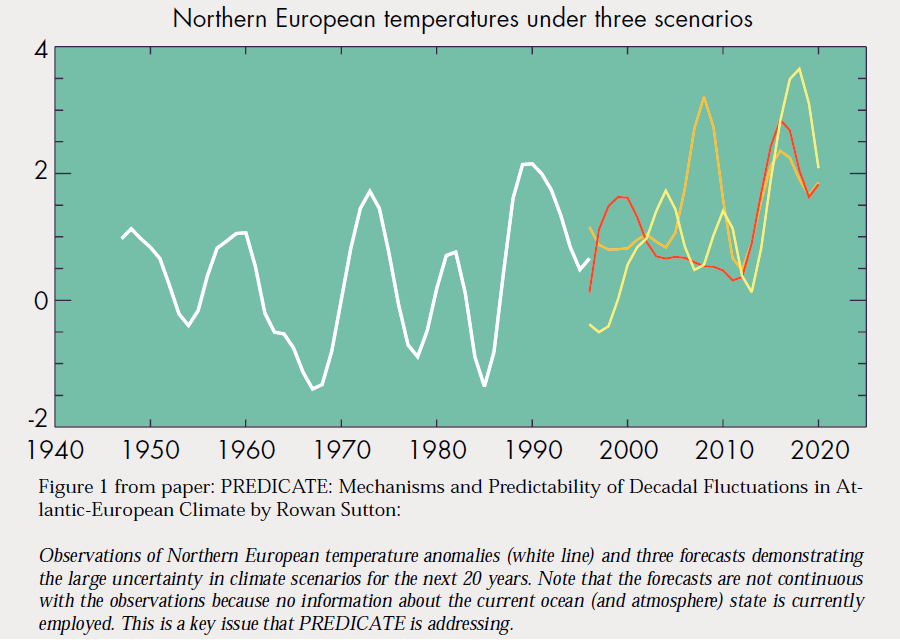
One of the earliest coordinated efforts which considered the role of variability in projections was the EU PREDICATE project which ran from 2000 to 2003. Figure 1 below (published in CLIVAR Exchanges #19 in 2001) shows observations and three projections of European temperatures from 1996 to 2020 with different realisations of the variability. This type of work helped motivate the use of initial condition information to make experimental decadal climate predictions.
The communication of the role of variability has increased markedly since the IPCC AR4 (which was unfortunately a little quieter on this topic), at least partly due to the recent slowdown. Recent articles, such as that of Deser et al., have helped this communication.
Further visualisations
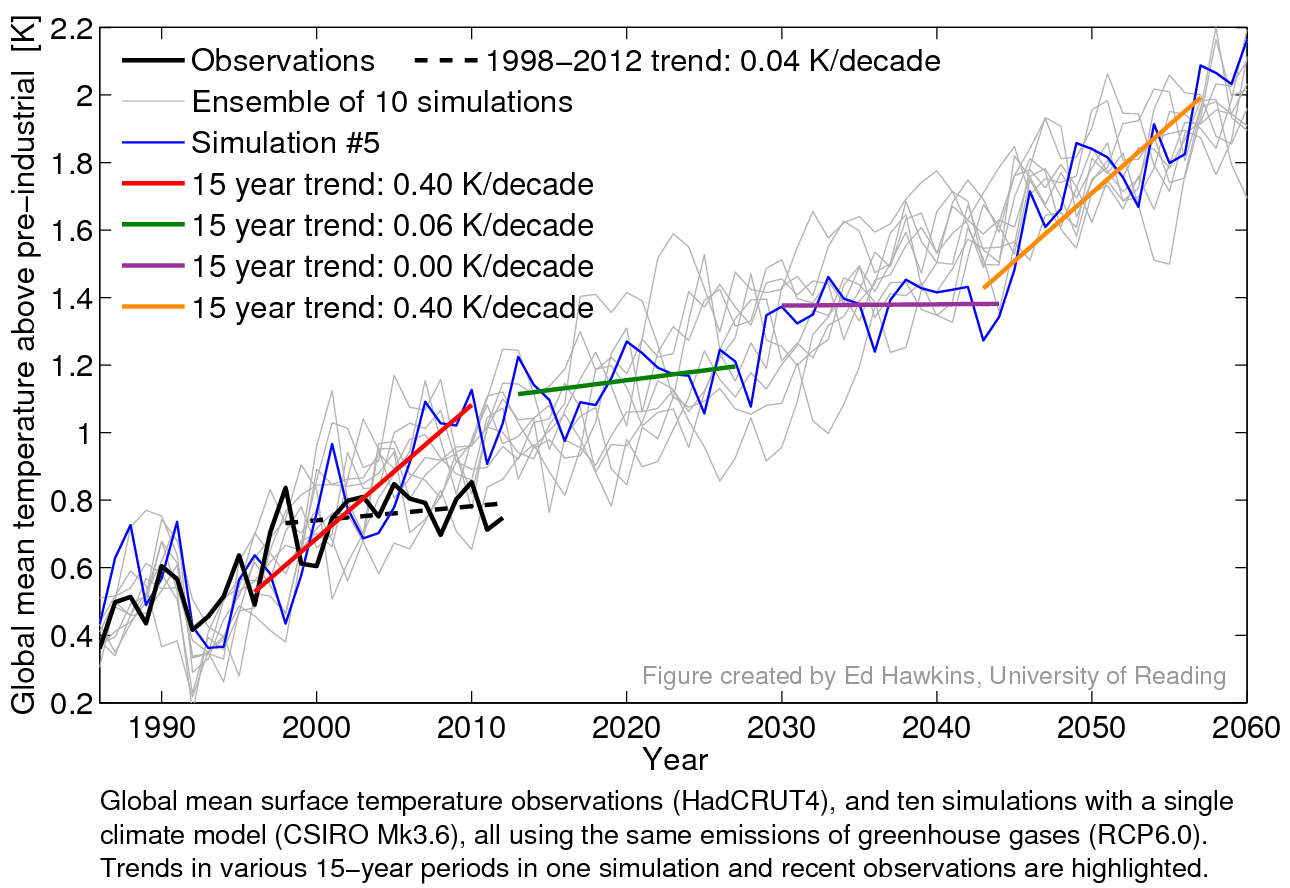
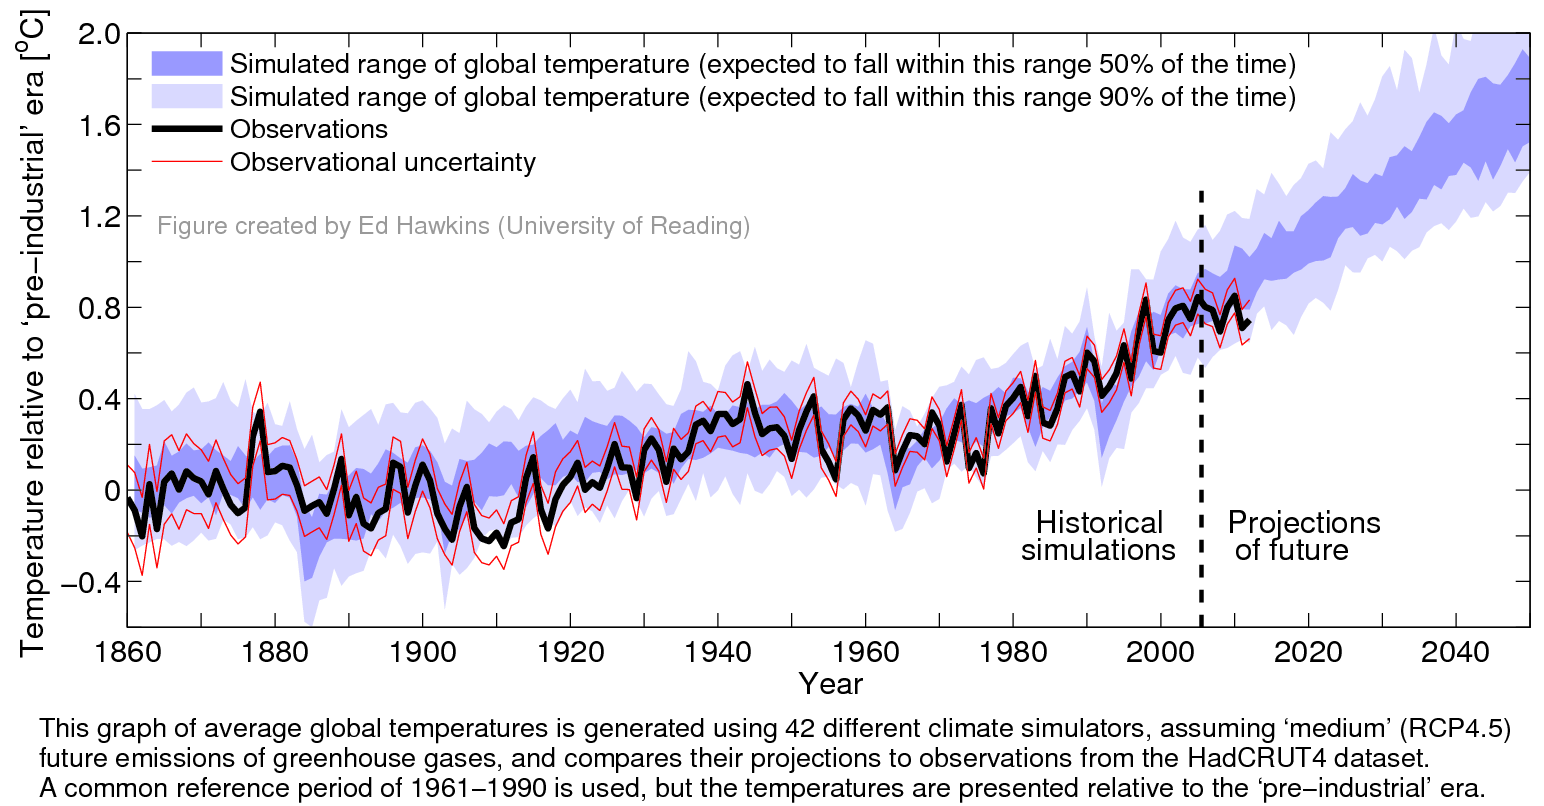
Two figures used at the briefing also appear below. The first highlights that simulations do show similar pauses to those seen in recent observations, and the second, which appears in the briefing note, will be familiar to regular readers of Climate Lab Book. It compares the observed global temperatures with the CMIP5 simulations, but with a longer term context than previous versions.
Summary
Overall, the important role of variability in near-term climate has been known since the early climate simulations, but perhaps not communicated as widely as it might have been.


Great post.
“As the observations of global temperature have always shown such variability it should not have been too surprising, but perhaps this message was not expressed or communicated clearly to the media before? Or perhaps it just was not as interesting to the media before?”
However, I do not believe the part that science has not communicated earlier about natural variability. The same climate “sceptics” that make such claims about the current deviation of about 0.2°C, claim that the entire warming we have seen since pre-industrial times of about 1°C is natural variability. This was one of the reasons for the recent debate on Long Range Dependence at Climate Dialog. If LRD is large, natural variability could explain a larger part of the observed secular trends.
There has been much talk about variations of insolation, about modes in the ocean (including ENSO,/El Niño and the NAO), the influence of volcanoes and aerosols. And a little less about the influence of variations in vegetation.
My guess is the the media is not very well informed about science and gets their talking points from the climate “sceptics” blogs. Which would fit the media being more interested in controversy as in information. Which is understandable, the controversial debunking posts at my blog get much more readers as he thoughtful scientific ones. Media companies need readers to sell advertisements.
“Computer models of the climate are not designed to capture the timings of “lumps and bumps” in the temperature record. Directly comparing observations with models in the short term is therefore misleading.” http://www.sciencemediacentre.org/wp-content/uploads/2013/07/SMC-Briefing-Notes-Recent-Slowdown-in-Global-Temperature-Rise.pdf
Correct me if I’m wrong but I thought climate models were assigned confidence at least partly based on their capture of the cooling effects of volcanic eruptions like Mt. Pinatubo? I.e. the time frame for such an event is even shorter than the recent pause yet the resolution for such a “bump” or “lump” is indeed present?
Correct – the ‘lumps & bumps’ in the briefing note refer to the “internal” variability of the climate system (e.g. the timing of a particular El Nino event for instance), rather than the volcanic effects. The timing of the past eruptions are, of course, known and used in the simulations.
cheers,
Ed.
Since we now have known global temperature data up to June, 2013, have any models been re-calibrated to simulate the current pause? If not, is such work underway?
Depends what you mean by “re-calibrated”?
If the pause is largely due to internal climate variability then there is nothing needed to be done as the models are not designed to predict the timing of these events, and as seen above they show similar features.
However, ideally the simulations since 2005 should be repeated with the observed volcanic and solar forcings to measure this effect, but that is a job for the people who run the CMIP5 simulations (which i do not!).
cheers,
Ed.
I think, if everyone has Al Gore assisted hockey sticks in their minds, then of course they don’t expect slow-downs.
Hi Ed,
I have an opinion, always a dangerous state of affairs.
We are attracted by the notion that a signal (observable) can be decomposed into an ex ante predictable part and a ex post residual. I hope I have chosen my words carefully.
Where the notion of the predictable part inherently relies on a theory (held to maintain its validity into the future) and some control variable time series either known ex ante or at least observable in real time.
This may lead us to a state of affairs for predicting the future of the signal, by increment, comparing it with which was observed and hence finding the unpredicted component on an ongoing basis.
If you believe any of that you find that a total absence of either a theory or information as to the controls results in a residual component (which is of course the same as the observed signal) that is totally unpredicted (a tautology) and statistically neutral in the sense that it is as unlikely as it is (another tautology). I apologise for this nonsense but I think it be a necessary basis.
Perhaps the simplest meaningful theory is that the predictable part of the observable is some fixed datum. The unpredicted part being the difference from that value. This residual does have useful statistics in the sense that we might say that some features of the series seem rather unlikely given the series as a whole. Some people are rather hostile to such statistics as was witnessed fairly recently with a particular analysis of temperature data for individual northern stations. The retort being that it simply makes rare events appear to be more likely than we know them to be (for we have a stronger theory that predicts more than a simple fixed datum). That is not perhaps the way it is phrased but it is my interpretation.
Applying such an analysis to determine the likelihood of the period of the pause given entirety of our observation of the globally averaged temperature signal tells me, (my opinion/analysis), that the current epoch is notable but not telling. This is much the same decision I might make from a visual perusal of the data (were it not that I have a theory). The pause is interesting, perhaps salient, as would be the general tendency for temperatures to have risen from the earlier to the later periods. However I would hold that there is little in the record that implies the current theory or perhaps any theory. The current theory comes from elsewhere, as it should, the relevant question being does the data confound the current theory. The current theory or rather its core basis actually came before the notable temperature rises of the last forty years, it is either essentially correct or essentially useless, and in a real sense no amount of data can alter whether it is an informative theory or not but it might make us doubt its validity and completeness. I believe this can be seen as a question of predictive power. Has the theory made an informative ex ante prediction of the signal?
Now there’s the rub. What do we mean by ex ante? And have we ever run the relevant experiment?
I will attempt to describe techniques that break a strict application of the ex ante restriction. Unfortunately the subtraction of various components such as those calculated on the basis of ex post values of ENSO, other oscilliations, even perhaps solar, fall foul of the restriction as I have posed it. Unless I have missed something none of these are applied as in a predicted (from theory and historical data) form, so they beg the question to be answered, they are parallel occurrences. Removal of a component from the residual based on ex post data alters the nature of the residual, it is no longer that which was unpredicted ex ante, and tends to give rise to statistics that are far narrower (have less variance) than the statistic we require (based on the residual to that which the theory predicted ex ante).
In general any fitting that relied on ex post data to construct the predicted component will inhibit our ability to construct statistics on which the theory can be fairly (according to my notions) judged.
I fear it may have been said that the simulators are an embodiment of theory, for I suspect they are more complex than that. That they be an admixture of theory and judgement based on what seems reasonable in the light of ex post observations. If that be the case, then I judge that the prediction of such simulations will tend to be confounded by observed outcomes at a significant rate due to their being based on more than the theory alone, and that it be folly to associate a failure of such simulations with a failure of the theory. Trust me, people will.
As I understand things, the MET Office’s position is that the current epoch although notable confounds neither the simulations nor the theory. There is a real and I must suggest mounting risk that the next few years may well confound the simulations. Put simply: given that an x year pause has occurred an x + y year pause is much more likely than the non-conditioned statistics would indicate. The risk may still be small for sake of argument let’s say 10%. Unless we make note now that there is a meaningful difference between what may predictable by theory and the outputs of the simulators we face a 10% risk of losing credibility should we seek to maintain the validity of the theory in that event.
I believe we are witness to, and discussing, a previous disconnect between what the simulations suggested and expert judgement based on that. If I go back about eight years, voicing concern over the wisdom, the certainty, of expert opinion meant swimming against the blog-tide of orthodox climate wisdom. It has become necessary to draw a distinction between what was sound and what was popular in the climate debate and to pull out examples of how we knew about, but commonly failed to acknowledge, the uncertain limits of predictability. It is good to emphasise that we were aware of that uncertainty and also that should have known better than to minimalise it; that the overconfidence was unwarranted. To pull legitimate evidence out of the archives, as we have now done, may restore credit to the simulations but at the deserved cost of discrediting much of the expert opinion as most popularly voiced.
We have had one bruising rub from our playing hostage to fortune and I must fear that we risk worse to come. That risk may be small but I think it be currently more growing than diminishing and not a risk worth taking unnecessarily.
So I return (at last they cry) to the necessary experiment. What ex ante prediction can we make from theory? Unfortunately I doubt that the simulators can answer that unaided. It is my best current judgement that they are too narrow, too overconfident.
There was an interesting public debate starting on an aspect of this point elsewhere and about a year ago on “All Models Are Wrong” which I think needs to be continued either here, there or elsewhere. An addressing of the problem of rendering the simulations informative in rigorously justifiable ways.
As to my proposed experiment: such may only be possible from weaker, more simple but stricter embodiments of theory. Some process under which we can justify or at least clearly state our basis for making the necessary ancillary assumptions and our uncertainties of our estimates. I am to be persuaded otherwise, but it is my prejudice to believe that the simulations go irreconcilably beyond what can justifiably be countenanced in terms of precision in the prediction of global mean temperatures based on theory and independent observations alone. The salient suspect being the tracking of the ensemble mean to the observed sequence from ~1960 until ~2000. I cannot help but think that such prior precision in tracking is not unrelated to the subsequent divergence; an outcome that I considered likely before it occurred.
If we are, as I believe, all to commonly drawing public attention to the output of overconfident simulations then disappointment should be expected.
Very informative and detailed posts ED. Plenty of info’ to digest.
I read the 3 part report by met office. Very detailed and presented like the IPCC reports l thought
Trying to contribute constructively here..
My input …
I was probably surprised that the role of winds at all layers was not included in the discussion of links to the warming hiatus
consider the role of winds …
Wind strength and direction related to vertical and horizontal mixing in the atmosphere and also ocean up welling and downwelling at the surface layer of the ocean
winds strength involved in rates of evaporation
the Jetstream pattern: that is so often muted as the cause of recent cold winters in the NH. not mentioned in report?
the increase of stratospheric warming events this decade..not mentioned..??
Changes to geopotential height at equator and poles?
———–
The last warming hiatus is likely caused by the same variable as the current hiatus
the quasi 60 yr oscillation. The timing fits like a glove.
The aerosol hypothesis as the cause of the last hiatus may be incorrect..
But you know this is just damage limitation and you know that uncertainties have always been downplayed in order to project a scary scenario. It doesn’t wash and is even contradictory. Models with 31 adjustable independent inputs can produce any anomaly you want but the global temperature they produce is never like reality. If they are so darn good at predicting pauses then why didn’t they predict this one? Answer; because anyone can hindcast but prediction is the test of a model and they are just no good at it and they are no good because the assumptions are wrong.
The fact is that natural variability was assumed to be in decline therefore models were assumed to require high levels of anthropogenic global warming in order to match the 20th century. This is the only actual ‘proof” that there is any AGW at all and the reason behind the >50% AGW after 1950 claim by the IPCC. Add higher levels of natural variability and there is no argument left for the existence of AGW and certainly no parabolic rise of the anomaly; just a continuation of the steady, unalarming natural rise that existed before 1950.
You can plead all you like for a convenient ‘warming masked by cooling’ rather than the simpler explanation of just ‘there is no AGW’ and you can invent unphysical mechanisms such as heat bypassing the upper ocean to get to the murky depths or you can rely on totally uncertain deus ex-machina aerosol arguments to fill the void but it just looks like desperate excuses for a climate community that just cannot admit that they know a lot less about climate than they pretend.
If this was just an academic exercise nobody would care but energy policy has been made on the basis of these models. Models that really only reflect the circular argumentation and hubris of the modelers. As a result much money has been wasted and we have put our entire energy future in jeopardy while at the same time putting up the cost of energy to the extent that people have to choose between heating and eating. The climate science community needs to stand back and realise the damage they have wrought on the basis of nothing more than a pessimistic gut feeling and a steady flow of funding for ever scarier scenarios. They don’t need to communicate better, they need to stop fooling themselves and to stop lying to government.