Update 10/03/11 – Accepted article also online. Comments very welcome.
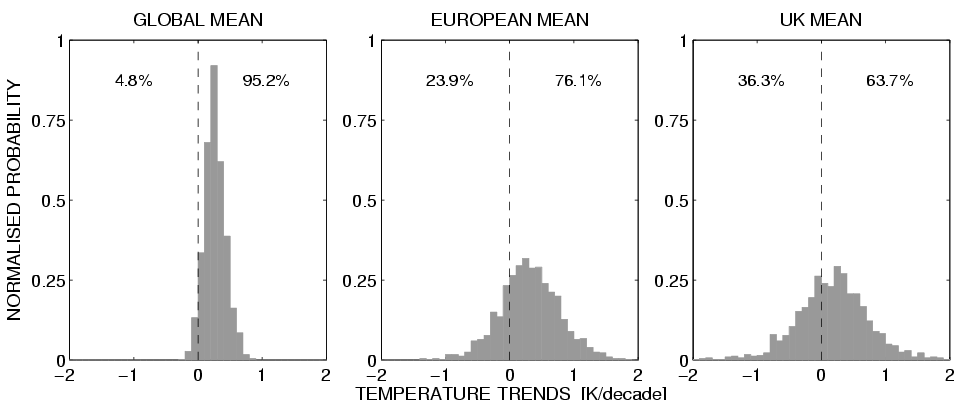
Communicating the differences and links between climate variability and climate change is of growing importance, and I am currently writing an article for “Weather” on this. One of the figures in the article is below – more to follow. Essentially, in a similar way to Easterling & Wehner, I have looked at decadal trends in a future temperatures for the A1B scenario for the range of IPCC models, using global means (a), and regional means (b – Europe, c – UK). The histograms show that as the region gets smaller the chance of a decade with a negative trend increases sharply from about 5% for a global mean to 36% for the UK.
