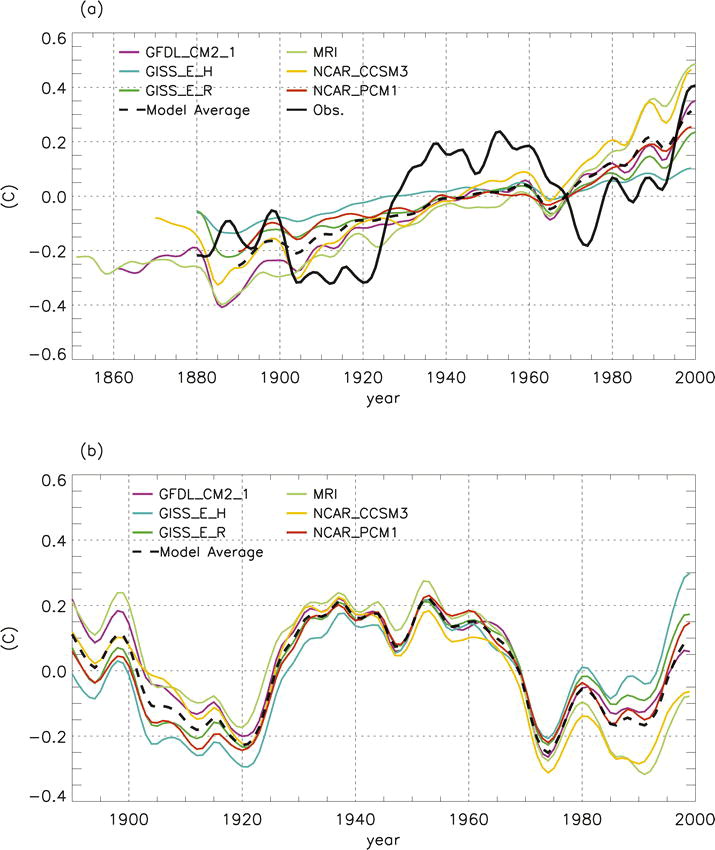
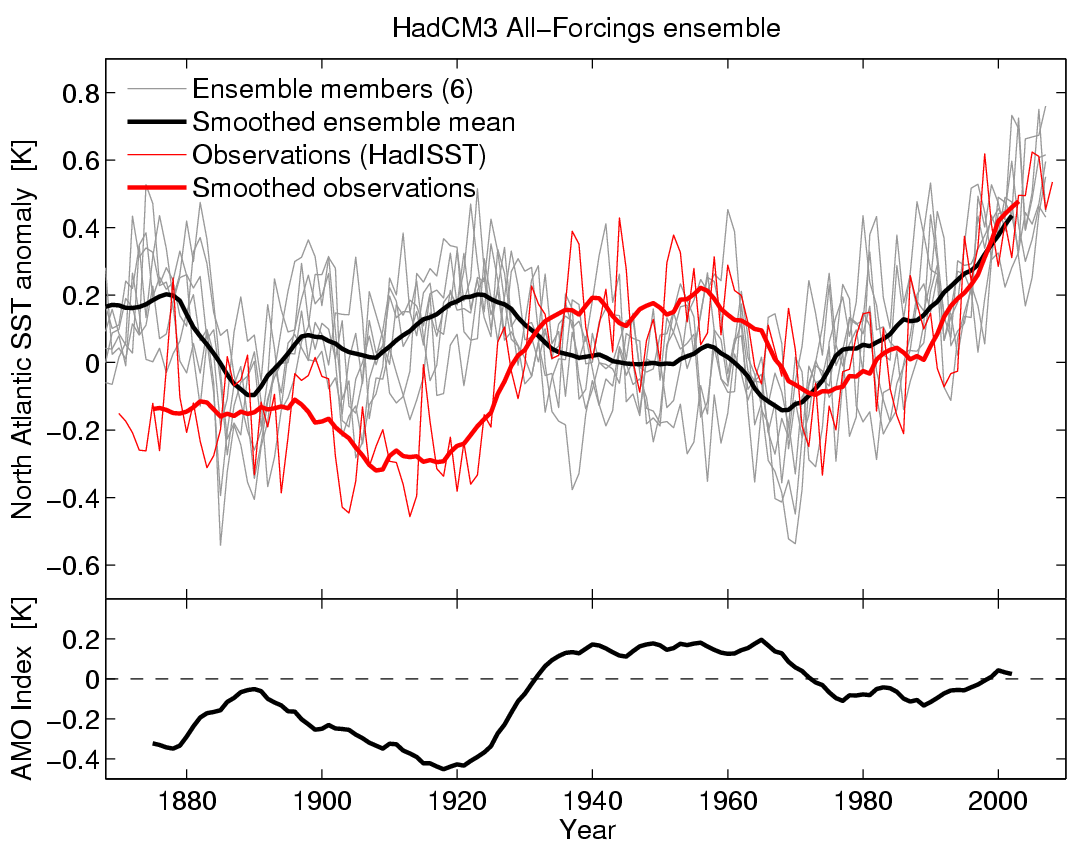
Observations of Atlantic SSTs show significant multi-decadal variability since 1870 (see red line in figure 2 below), often termed the Atlantic Multi-Decadal Oscillation (AMO), though there is no clear evidence that it is really an ‘oscillation’. There is discussion about whether this variability is due to external forcings or internal processes. Ting et al (2009) published Figure 1 below showing a range of GCM estimates of the AMO, suggesting that it is an internal fluctuation (like many other authors). Figure 2 is an estimate from HadCM3 using the raw output from the GCM rather than using the EOF methodology of Ting et al. Although the AMO is similar, there does appear to be a bit of a trend, and would be an outlier when compared to the other GCMs.


Hi Ed,
Just come across your site while looking for one of you variability-scenario-physics uncertainty plots to use in a talk. It looks like an interesting experiment. Good to see you do this.
I’ve been thinking about Ting et al 2009, AMO and aerosols. One question which the community has been looking at is what extent is the AMO a wholly natural mode vs changes associated with global climate changes. Ting et al, goes a long way with this by removing the signal that would have been expected from the a forced climate response (by removing a composite of 3 GCM forced responses). The residual, Ting argues, is the natural variability of this ocean mode (AMO). However, I think we maybe underestimating the forced response – as the contribution of historical aerosols changes on Atlantic temperatures is likely to have been underestimated (2 of the 3 models Ting uses don’t represent indirect aerosol effects and the only third prescribes the first indirect effect from an offline estimate). Could this explain your differences between HadCM3 and Ting? Does your configuration of HadCM3 represent the interactive aerosol effects?
Hi Ben, and thanks for being the first commenter!
I agree – it has always been intriguing to me that the decline in the AMO in the 1960s is also the same period that aerosols are thought to have cooled the global climate. I am not convinced that the AMO is all internal variability either. The CMIP5 runs will be interesting to analyse as more of the GCMs will have the aerosol affects better represented I think.
There is also an interesting recent paper using the Bergen Climate Model by Ottera et al. who argue that the volcanic forcings play a crucial role in pacemaking the variability. This GCM also seems to show an NAO response to volcanic forcing similar to observations, unlike most other GCMs.
PS. I think it is the standard version of HadCM3 that was used. I didn’t do the runs myself.